NOAA released the first images from their new GOES-16 satellite and to say they are stunning would be an understatement. The new satellite, built in Colorado by Lockheed Martin, contains some of the highest resolution cameras and most advanced sensors in the world.
From NOAA:
Since the GOES-16 satellite lifted off from Cape Canaveral on November 19, scientists, meteorologists and ordinary weather enthusiasts have anxiously waited for the first photos from NOAA’s newest weather satellite, GOES-16, formerly GOES-R.
The release of the first images today is the latest step in a new age of weather satellites. It will be like high-definition from the heavens.
- Scroll down to view all of the new images released by NOAA
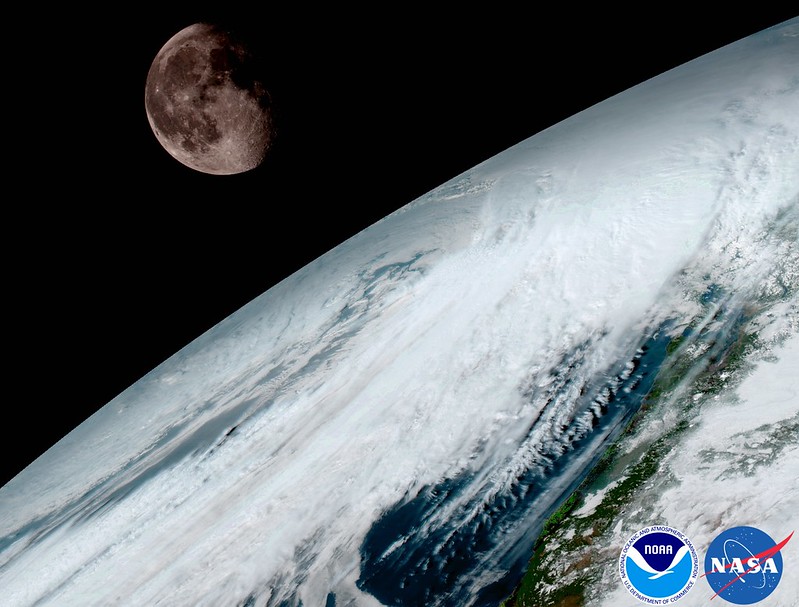
The pictures from its Advanced Baseline Imager (ABI) instrument, built by Harris Corporation, show a full-disc view of the Western Hemisphere in high detail — at four times the image resolution of existing GOES spacecraft. The higher resolution will allow forecasters to pinpoint the location of severe weather with greater accuracy. GOES-16 can provide a full image of Earth every 15 minutes and one of the continental U.S. every five minutes, and scans the Earth at five times the speed of NOAA’s current GOES imagers.
NOAA’s GOES-16, situated in geostationary orbit 22,300 miles above Earth, will boost the nation’s weather observation network and NOAA’s prediction capabilities, leading to more accurate and timely forecasts, watches and warnings.
“This is such an exciting day for NOAA! One of our GOES-16 scientists compared this to seeing a newborn baby’s first pictures — it’s that exciting for us,” said Stephen Volz Ph.D. director of NOAA’s Satellite and Information Service. “These images come from the most sophisticated technology ever flown in space to predict severe weather on Earth. The fantastically rich images provide us with our first glimpse of the impact GOES-16 will have on developing life-saving forecasts.”
In May, NOAA will announce the planned location for GOES-16. By November 2017, GOES-16 will be operational as either GOES-East or GOES-West. Once operational, NOAA will use the satellite’s six new instruments to generate new or improved meteorological, solar, and space weather products.
Second satellite in GOES series already in development
Following on the heels of GOES-R will be, GOES-S, the second of four spacecraft in the series. GOES-S is undergoing environmental testing at Lockheed Martin’s Corporation facility in Littleton, Colorado, where it was built. A full set of environmental, mechanical and electromagnetic testing will take about one year to complete. The GOES-S satellite will be moved into the other operational position as GOES-17 immediately after launch and initial checkout of the satellite, approximately nine months after GOES-16.
| [flickr_set id=”72157679494723805″] |


")
")