Absolutely insane satellite imagery from CSU’s Cooperative Institute for Research in the Atmosphere (CIRA) of a dust storm as it moves south across northern Mexico this past Saturday.
Tag Archives: Satellite Imagery
NOAA releases first images from new GOES satellite
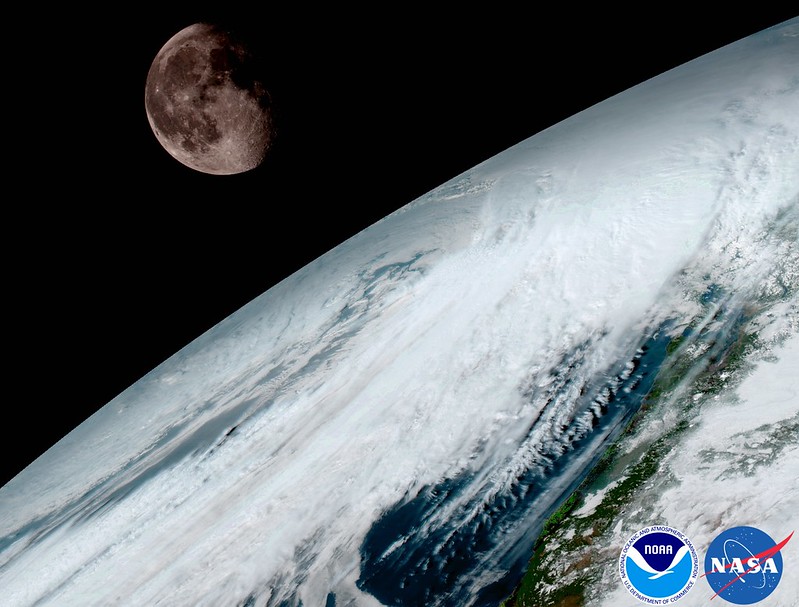
NOAA released the first images from their new GOES-16 satellite and to say they are stunning would be an understatement. The new satellite, built in Colorado by Lockheed Martin, contains some of the highest resolution cameras and most advanced sensors in the world.
From NOAA:
Since the GOES-16 satellite lifted off from Cape Canaveral on November 19, scientists, meteorologists and ordinary weather enthusiasts have anxiously waited for the first photos from NOAA’s newest weather satellite, GOES-16, formerly GOES-R.
The release of the first images today is the latest step in a new age of weather satellites. It will be like high-definition from the heavens.
- Scroll down to view all of the new images released by NOAA
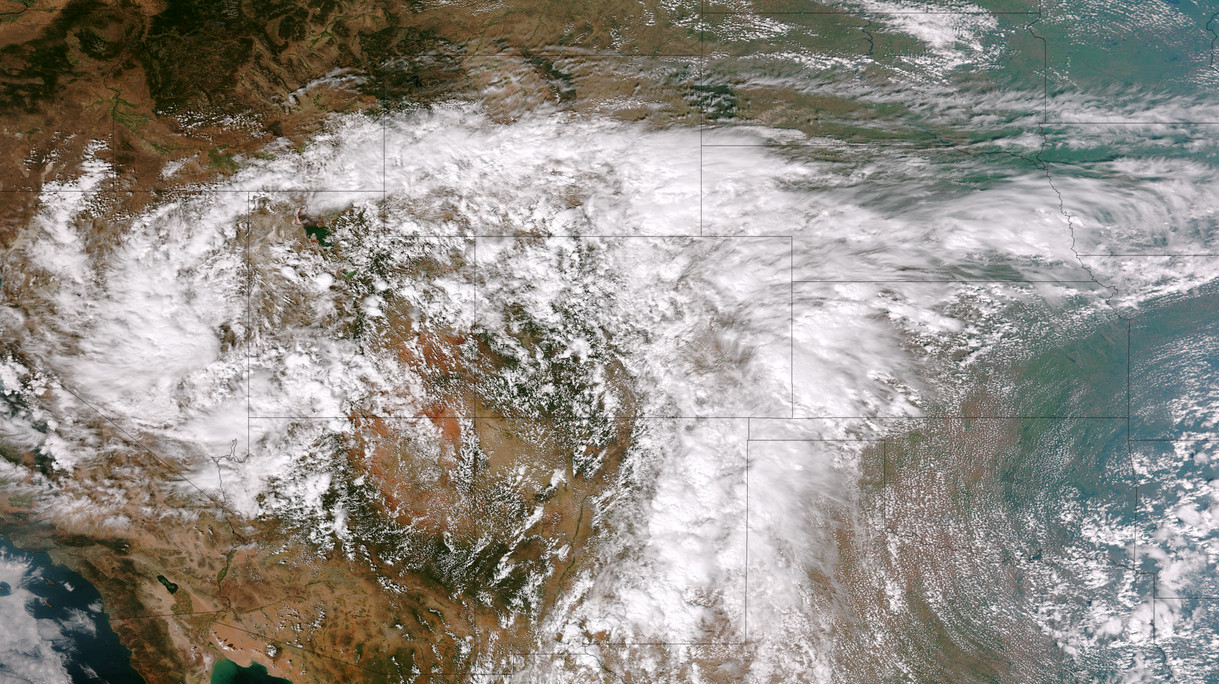
The pictures from its Advanced Baseline Imager (ABI) instrument, built by Harris Corporation, show a full-disc view of the Western Hemisphere in high detail — at four times the image resolution of existing GOES spacecraft. The higher resolution will allow forecasters to pinpoint the location of severe weather with greater accuracy. GOES-16 can provide a full image of Earth every 15 minutes and one of the continental U.S. every five minutes, and scans the Earth at five times the speed of NOAA’s current GOES imagers.
NOAA’s GOES-16, situated in geostationary orbit 22,300 miles above Earth, will boost the nation’s weather observation network and NOAA’s prediction capabilities, leading to more accurate and timely forecasts, watches and warnings.
“This is such an exciting day for NOAA! One of our GOES-16 scientists compared this to seeing a newborn baby’s first pictures — it’s that exciting for us,” said Stephen Volz Ph.D. director of NOAA’s Satellite and Information Service. “These images come from the most sophisticated technology ever flown in space to predict severe weather on Earth. The fantastically rich images provide us with our first glimpse of the impact GOES-16 will have on developing life-saving forecasts.”
In May, NOAA will announce the planned location for GOES-16. By November 2017, GOES-16 will be operational as either GOES-East or GOES-West. Once operational, NOAA will use the satellite’s six new instruments to generate new or improved meteorological, solar, and space weather products.
Second satellite in GOES series already in development
Following on the heels of GOES-R will be, GOES-S, the second of four spacecraft in the series. GOES-S is undergoing environmental testing at Lockheed Martin’s Corporation facility in Littleton, Colorado, where it was built. A full set of environmental, mechanical and electromagnetic testing will take about one year to complete. The GOES-S satellite will be moved into the other operational position as GOES-17 immediately after launch and initial checkout of the satellite, approximately nine months after GOES-16.
| [flickr_set id=”72157679494723805″] |
NASA satellite imagery shows California’s monstrous Blue Cut Fire

The Blue Cut Fire, just outside of Los Angeles, is a quickly growing fire that is currently an imminent threat to public safety, rail traffic and structures in the Cajon Pass, Lytle Creek, Wrightwood, Oak Hills, and surrounding areas. An estimated 34,500 homes and 82,640 people are being affected by the evacuation warnings that have been issued. This wildfire started on August 16, 2016 and the cause is unknown. In the last two days the fire has grown to 31,689 acres with 1584 personnel on scene. 178 engines, 26 crews, 10 air tankers, 2 Very Large Air Tankers (VLATS), and 17 Helicopters, including night flying helicopters. Additional firefighters and equipment have been ordered and will be responding directly to the fire. An unknown number of structures are damaged and destroyed. A smoke advisory has been issued for portions of San Bernardino Country.
Unfortunately extreme weather is continuing in the area with hot, dry and breezy (20 mph with gusts to 30 mph) conditions. Very poor relative humidity will continue. All of these will hinder fire fighting efforts and may increase fire spread.
NASA’s Suomi NPP satellite collected this natural-color image using the VIIRS (Visible Infrared Imaging Radiometer Suite) instrument on August 17, 2016. Actively burning areas, detected by thermal bands, are outlined in red. NASA image courtesy Jeff Schmaltz LANCE/EOSDIS MODIS Rapid Response Team, GSFC. Caption by Lynn Jenner with information from Inciweb.
Suomi NPP is managed by NASA, NOAA and the U.S. Department of Defense.
Last Updated: Aug. 18, 2016
Editor: Lynn Jenner
Before and after: NASA satellite imagery shows effects of Washington state landslide
As many as two dozen people were killed on Saturday, March 22, 2014 when a massive landslide swept down a rain-soaked hill near Oso, Washington. NASA satellite imagery taken before and after the event shows the extent of the event.
Using the ‘sliders’ on the image below you can compare how the area looks normally (left) versus how it looked after the landslide (right).
[wpw_ba_viewer width=”600″ height=”auto” anim_speed=”600″ start_percent=”0.5″ disable_intro=”false”]
[wpw_ba_img src=”http://lh6.googleusercontent.com/-I2mSOZBkFnQ/UzMQFKXi74I/AAAAAAAAB0s/tcA9N10o6cY/s600/wa-before.jpg” data_second=”http://lh5.googleusercontent.com/-VXmVfoDsFqQ/UzMQFPSNLNI/AAAAAAAAB0w/kIX2gla6sTA/s600/wa-after.jpg” title=”Satellite imagery comparison of the area near Oso, Washington before and after the March 22, 2014 landslide. (NASA EO)” data_info=”Satellite imagery comparison of the area near Oso, Washington before and after the March 22, 2014 landslide. (NASA EO)”]
[/wpw_ba_viewer]
From NASA:
On March 22, 2014, a rainfall-triggered landslide near Oso, Washington sent muddy debris spilling across the North Fork of the Stillaguamish River. The debris engulfed numerous homes, resulting in the deaths of at least 14 people. As of March 25, authorities reported that 176 people were still missing.
The slide left an earthen dam that blocked the river, causing a barrier lake to form. The Operational Land Imager (OLI) on Landsat 8 acquired this image of landslide debris and the barrier lake on March 23, 2014. An image of the same area acquired on January 18, 2014, is shown for comparison.
As water backed up, it raised fears of a potential flash flood. On March 23, water began to flow around the north side of the dam. However, as of the afternoon of March 25, a flash flooding watch issued by the National Weather Service remained in effect for parts of Snohomish county.
According to Durham University geologist Dave Petley, the landslide was a reactivation of an earlier landslide that caused problems in 1988 and 2006.
Satellite imagery provides bird’s eye view of Earth at the change of seasons
Satellite imagery provides bird’s eye view of Earth at the change of seasons.
Pretty neat imagery and explanation from NASA:
Enjoy the Equinox!
Every year, there are two equinoxes. One is in March; the other is in September. In 2014, the March equinox falls on March 20, 2014. On the equinoxes, the sun shines directly on the equator and the length of day and night is nearly equal. Seasons are opposite on either side of the equator, so the March equinox is called the spring (or vernal) equinox in the northern hemisphere. But in the southern hemisphere, it’s known as the fall (autumnal) equinox. What do equinoxes look like from space? The Spinning Enhanced Visible and Infrared Imager (SEVIRI) on EUMETSAT’s Meteosat-9 captured these four views of Earth from geosynchronous orbit. The images show how sunlight fell on the Earth on December 21, 2010 (upper left), and March 20 (upper right), June 21 (lower left), and September 20, 2011 (lower right). Each image was taken at 6:12 a.m. local time. Notice how on March 20 and September 20, the terminator — the divide between day and night — is a straight north-south line, and the Sun is said to sit directly above the equator. Equinox means “equal night” in Latin, capturing the idea that daytime and nighttime are equal lengths everywhere on the planet.
Read more about the equinoxes and solstices at
http://
See a video of the equinoxes and solstices from space at
http://www.youtube.com/
Read more about the March Equinox from Date and Time at
http://

NOAA imagery shows population centers and road transportation network

Millions of Americans will be taking to the highways of byways of the nation in the coming weeks for various holiday travels. Imagery released by NOAA this week shows how the nation’s major roadways intersect with the major population centers.
A nighttime satellite image of the nation was taken by the Suomi NPP satellite taken last month near the new moon when light from space was relatively low. This allowed NOAA to generate an image showing population centers from coast to coast.
When overlaid with a graphic of major interstate highways, railroads, and rivers, the images provide insight into how the nation evolved.
Early in the nation’s history, rivers were the major means of transportation and population centers developed around them. As we expanded and the national highway system took shape, major roads connected the cities.
Below we have added an interactive slider to allow you to compare the surface travel networks with the satellite image. Simply move it side to side to compare.
[wpw_ba_viewer width=”600″ disable_intro=”false” alternate_skin=”true”]
[wpw_ba_img src=”http://lh3.googleusercontent.com/-sz3WguZ6u70/UpT_qACKk2I/AAAAAAAAA6E/F8lNPrVHqBs/s600/us_vir_2013274_720.jpg” data_alt=”http://lh3.googleusercontent.com/-ccGCWfWTc1A/UpT_qGByopI/AAAAAAAAA54/N_VcvIEcg6w/s600/us_vir_2013274_720_maps.jpg” title=””]
[/wpw_ba_viewer]
That isn’t clouds on Tuesday morning’s satellite imagery
This morning’s satellite imagery runs are showing some interesting white cover on Colorado’s landscape and it isn’t clouds. In fact, we see virtually entirely cloudless skies across the state.
That white stuff is in fact snow, the first covering of the season at higher elevations. Some locations Sunday night / Monday morning received up to six inches of the white stuff.
Satellite imagery clearly shows the snow in parts of the San Juan Mountains to the southwest as well as the Elk and Sawatch ranges, the Flat Tops and even the western parts of the Front Range mountain areas.
It likely won’t be long before the Front Range sees its own snowfall. Denver’s first freeze on average occurs on October 7th. Its first snowfall on October 19th.
More Denver cold weather statistics can be found here.

Before and after: NASA satellite imagery reveals flood damage in Colorado
Colorado’s September 2013 floods have been absolutely devastating with over 1,500 homes destroyed and a death toll yet to be finalized. NASA satellites flew over the area near Greeley in recent days and the before and after pictures provide a stunning view from above of the devastation.
Using the ‘sliders’ on the two image sets below you can compare how the area looks normally versus how it looked in the days immediately after the flooding.
[wpw_ba_viewer width=”600″ height=”auto” anim_speed=”600″ start_percent=”0.5″ disable_intro=”false”]
[wpw_ba_img src=”http://lh6.googleusercontent.com/-EHZnr2QxwDo/UjxBTiFTICI/AAAAAAAAArY/lN8SZl9OGLs/s600/greeley-before.jpg” data_second=”http://lh3.googleusercontent.com/-Afkp7QnthD8/UjxBTnDEMrI/AAAAAAAAArU/QsAh-2SWRkw/s600/greeley-after.jpg” title=”Satellite imagery comparison of the area near Greeley, Colorado before and after the September 2013 flooding. (NASA EO)” data_info=”Satellite imagery comparison of the area near Greeley, Colorado before and after the September 2013 flooding. (NASA EO)”]
[/wpw_ba_viewer]Satellite Imagery of Flooding Near Greeley, Colorado – “Though water levels on the South Platte River were receding, muddy brown waters were still out of the river’s banks near Greeley, Colorado, on September 17, 2013, when the Operational Land Imager (OLI) on the Landsat 8 satellite acquired this image. At the time, the river was more than six feet above flood stage, down from more than eight feet above flood stage.” The before image was acquired on June 29, 2013 and shows the area as it normally appears. (NASA EO)
[wpw_ba_viewer width=”600″ height=”auto” anim_speed=”600″ start_percent=”0.5″ disable_intro=”false”]
[wpw_ba_img src=”http://lh4.googleusercontent.com/-4P17RwE0yJ4/UjxBUXq6AEI/AAAAAAAAArc/jf6eRTTMaeQ/s600/platte-before.jpg” data_second=”http://lh6.googleusercontent.com/-oFx1h0x653Y/UjxBTgBj2KI/AAAAAAAAArM/-rgcmbR2otk/s600/platte-after.jpg” title=”Satellite imagery comparison of the area near Greeley, Colorado before and after the September 2013 flooding. (NASA EO)” data_info=”Satellite imagery comparison of the area near Greeley, Colorado before and after the September 2013 flooding. (NASA EO)”]
[/wpw_ba_viewer]Infrared Satellite Imagery of Flooded South Platte River – “Intense rainfall in northern and eastern Colorado brought widespread, destructive flooding in mid-September 2013. Local citizens reported as much as 18 inches (46 centimeters) of rain from September 9 to 15, with some of the heaviest accumulation along the Front Range of the Rocky Mountains. A break in the precipitation allowed the Moderate Resolution Imaging Spectroradiometer (MODIS) on NASA’s Aqua satellite to acquire the top image of the floods on September 14. The second image, taken by Terra MODIS on September 7, 2013, shows the region before the rains began. The images were made from infrared light to increase the contrast between water and land.” (NASA EO)
NOAA satellite image captures ‘biblical’ storm as it strikes Colorado
* Click the image above for a larger view
Five days of rain, one with absolutely torrential downpours, created dangerous and deadly flooding across much of the Colorado Front Range. At one point the National Weather Service warned of ‘biblical rainfall amounts’ and it became hard to argue with that terminology. The rainfall amounts were truly astounding.
Boulder, where some of the worst flooding was seen, recorded 9.08” on Thursday, September 12. Estes Park, where the Big Thompson River flooded its banks, saw 3.9” over the 24 hour period.
Officially Denver only saw 1.1” on the date but that was as measured at Denver International Airport which only saw the edge of the storms. At the previous historical location in Stapleton, 3.68” was measured.
Here in Thornton we seemed to be right in line for the storms and generated one of the higher totals in the metro area accumulating 4.76” on the date. Since the rain started five days ago, we have received an amazing 7.66” (as of this writing).
First images from new Landsat satellite capture northern Colorado Front Range
For four decades Landsat satellites have beamed back amazing pictures of the Earth from their perch far above the planet’s surface. The latest craft in the series was launched last month and among the first images it captured were pictures of the area around Fort Collins and the Galena Fire burn scar.
The Landsat Data Continuity Mission took to space on February 11 to continue the joint program between NASA and the USGS. This latest spacecraft has some of the highest resolution imagery devices of any Earth-observing satellite and will allow the agencies to monitor the natural and human processes taking place on the planet.
This week NASA released some of the first images from the new craft including its ‘Image of the Day’ from the Earth Observatory program on Thursday. The photos capture the northern Colorado Front Range in natural color and one showing wavelengths of light not seen by the human eye. The city of Fort Collins is clearly seen as is the Galena Fire burn scar west of Horsetooth Reservoir.
Below the images are further explanation from NASA.
")
")
From NASA:
On March 18, 2013, the newly launched Landsat Data Continuity Mission (LDCM) began to send back images of Earth from both of its instruments—the Operational Land Imager (OLI) and the Thermal Infrared Sensor (TIRS). This view of Fort Collins, Colorado, is among the satellite’s first images.
The images above are close-up views from the OLI sensor at its maximum resolution of 15 meters per pixel. The top image displays natural color, while the second image blends shortwave infrared, near-infrared, and green wavelengths (LDCM bands 7, 5, 3). The close-ups were cropped from larger Landsat scenes (downloadable beneath each web image) that show where the Great Plains meet the Front Range of the Rocky Mountains in Wyoming and Colorado.
“The first OLI and TIRS images look great right out of the box,” said Jim Irons, LDCM project scientist. “I have waited a long time to view the first LDCM images and I could not be more impressed with their appearance.”
Made with reflected red, green, and blue light, the top image shows Fort Collins as the human eye would see it. The city is a gray grid surrounded by the curving roads and brown yards of residential neighborhoods. White clouds cast black shadows on the ground below. Land freshly burned in the Galena fire is charcoal black—just slightly darker than the dark green coniferous forest to its west.
The second image shows Fort Collins in wavelengths of light not usually visible to people. Plants are green, city areas are purple, snow is pale blue, and bare earth is tan-pink. This combination of visible and infrared light reveals features of the landscape not otherwise visible. For example, irrigated parks, yards, and golf courses are bright green in this image, but brown in natural color. The Galena Fire burn scar is dark red and easy to distinguish from its surroundings.
The Landsat Data Continuity Mission was launched on February 11, 2013, to continue the four-decade-long Landsat record of Earth’s landscapes. LDCM represents an evolutionary advancement in technology from previous Landsat sensors, collecting more data daily and with greater fidelity. The imagers also include two new bands to improve the view of clouds and near-shore waters.
LDCM’s normal operations are scheduled to begin in late May 2013, after the instruments have been calibrated and the spacecraft has been fully checked out. At that time, NASA will hand over control of the satellite to the U.S. Geological Survey, and the satellite will be renamed Landsat 8.
Read more about LDCM and its imagery in the NASA story: A Closer Look at LDCM’s First Scene.