The month of April lacked much in the way of drama for northeastern Colorado. Overall temperatures were warmer than normal and precipitation and snow were lacking a bit.
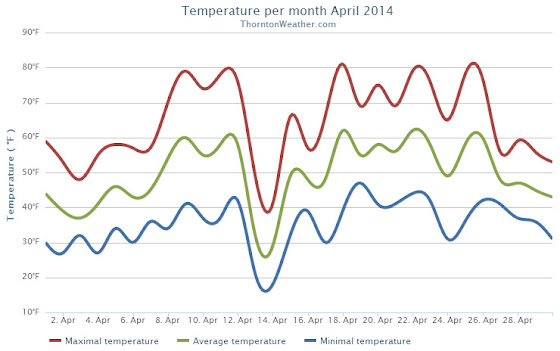
April started out on the cool side and brought the first snow of the month on the 3rd. By the 8th temperatures had rebounded and we enjoyed a five-day stretch of high temps in the 70s.
A storm system and cold front cooled things down on the 13th and we saw a couple of days of light snowfall. As always the weather bounced back and Thornton recorded its first 80+ degree day of the year on the 18th.
The final four days of the month saw things turn cool again. Some light rain was seen but the bigger story was a period of unusually windy conditions.
Denver’s average April temperature is 47.4 degrees (1981 – 2010). For April 2014, the average temperature in Thornton was more than two degrees higher at 49.6 degrees. Out at Denver International Airport, the average came in a bit cooler at 49.0 degrees.
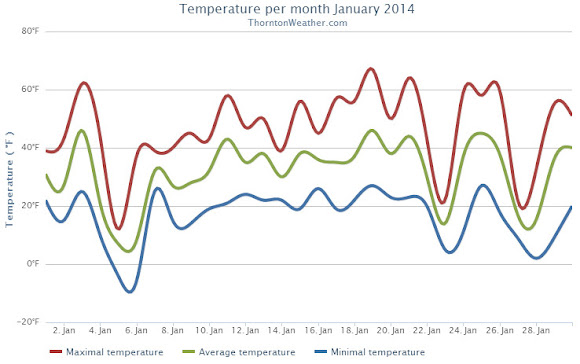
Temperatures in Thornton ranged from a high of 81.3 degrees on the 18th down to a low of 17.6 degrees on the 14th. DIA saw its warmest reading of 80 degrees on the 22nd and its coldest of 18 degrees on the 14th.
Low temperatures dropped below freezing on 11 days in Thornton. No readings below zero were recorded.
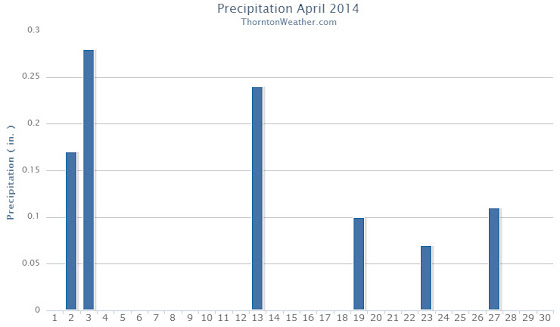
In terms of precipitation, Thornton measured 0.97 inch in the bucket. This is a good ways below the Denver April average of 1.71 inches. DIA saw more precipitation than us with a reading of 1.24 inches.
Similarly, snowfall fell short of normal in Thornton and Denver. On average the Mile High City sees 6.8 inches in April. Thornton recorded only 5.5 inches and DIA 5.6 inches.
Click here to view Thornton’s March 2014 climate report.
CLIMATE REPORT
NATIONAL WEATHER SERVICE BOULDER, CO
603 AM MDT THU MAY 1 2014

...................................

...THE DENVER CO CLIMATE SUMMARY FOR THE MONTH OF APRIL 2014...

CLIMATE NORMAL PERIOD 1981 TO 2010
CLIMATE RECORD PERIOD 1872 TO 2014

WEATHER         OBSERVED          NORMAL  DEPART  LAST YEAR`S
                 VALUE   DATE(S)  VALUE   FROM    VALUE  DATE(S)
                                          NORMAL
................................................................
TEMPERATURE (F)
RECORD
 HIGH              90   04/30/1992
 LOW               -2   04/02/1975
HIGHEST            80   04/22        90     -10       80  04/29
LOWEST             18   04/14        -2      20        6  04/10
AVG. MAXIMUM     62.8              61.5     1.3     54.7
AVG. MINIMUM     35.2              33.3     1.9     28.7
MEAN             49.0              47.4     1.6     41.7
DAYS MAX >= 90      0               0.0     0.0        0
DAYS MAX <= 32      0               0.3    -0.3        4
DAYS MIN <= 32     10              13.0    -3.0       17
DAYS MIN <= 0       0               0.0     0.0        0
PRECIPITATION (INCHES)
RECORD
 MAXIMUM         8.24   1900
 MINIMUM         0.03   1963
TOTALS           1.24              1.71   -0.47     1.87
DAILY AVG.       0.04              0.06   -0.02     0.06
DAYS >= .01         6               9.1    -3.1       13
DAYS >= .10         5               4.5     0.5        7
DAYS >= .50         0               0.9    -0.9        0
DAYS >= 1.00        0               0.5    -0.5        0
GREATEST
 24 HR. TOTAL    0.48   04/02 TO 04/03              0.50
                                                04/22 TO 04/23
SNOWFALL (INCHES)
TOTAL             5.6               6.8

DEGREE_DAYS
HEATING TOTAL     472               529     -57      690
 SINCE 7/1       5730              5731      -1     5802
COOLING TOTAL       0                 1      -1        0
 SINCE 1/1          0                 1      -1        0

FREEZE DATES
RECORD
 EARLIEST     09/08/1962
 LATEST       06/08/2007
EARLIEST                        10/07
LATEST                          05/05
......................................................

WIND (MPH)
AVERAGE WIND SPEED              12.9
RESULTANT WIND SPEED/DIRECTION   2/299
HIGHEST WIND SPEED/DIRECTION    49/340    DATE  04/29
HIGHEST GUST SPEED/DIRECTION    66/340    DATE  04/29

SKY COVER
POSSIBLE SUNSHINE (PERCENT)   MM
AVERAGE SKY COVER           0.70
NUMBER OF DAYS FAIR            1
NUMBER OF DAYS PC             22
NUMBER OF DAYS CLOUDY          7

AVERAGE RH (PERCENT)     50

WEATHER CONDITIONS. NUMBER OF DAYS WITH
THUNDERSTORM              0     MIXED PRECIP               0
HEAVY RAIN                0     RAIN                       3
LIGHT RAIN                8     FREEZING RAIN              0
LT FREEZING RAIN          0     HAIL                       1
HEAVY SNOW                2     SNOW                       3
LIGHT SNOW                6     SLEET                      0
FOG                       8     FOG W/VIS <= 1/4 MILE      2
HAZE                      1

-  INDICATES NEGATIVE NUMBERS.
R  INDICATES RECORD WAS SET OR TIED.
MM INDICATES DATA IS MISSING.
T  INDICATES TRACE AMOUNT.


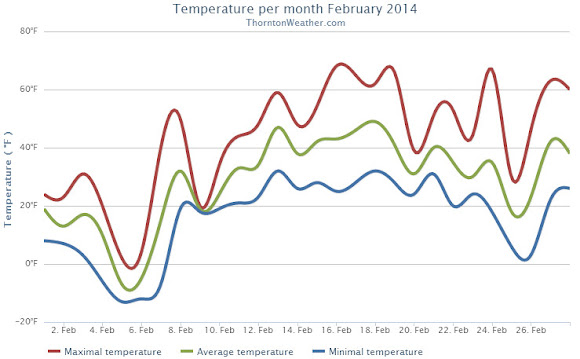


 February in Colorado typically brings to an end an extended period when average temperatures are at their lowest. Winter begins to loosen its grip and temperatures get warmer but precipitation is not a particularly common event during the month.