Colorado’s famously highly variable weather seems to showcase itself during the month of May when a variety of weather conditions can be seen.
Winter-like temperatures and snow are possible as are mid-summer like temperatures or the more typical spring severe weather.
As the month starts out in 2014 we are going to enjoy a mild period with unseasonably warm temperatures and dry conditions. Long range forecasts predict a relatively ‘normal’ May.
However the month can bring extremes. Snow is not entirely uncommon during the month, oftentimes causing damage to newly bloomed trees. More common however is severe weather, particularly in the latter half of the month. Thunderstorms become more frequent and their associated hazards – lightning, wind, hail and tornadoes – are usual visitors.
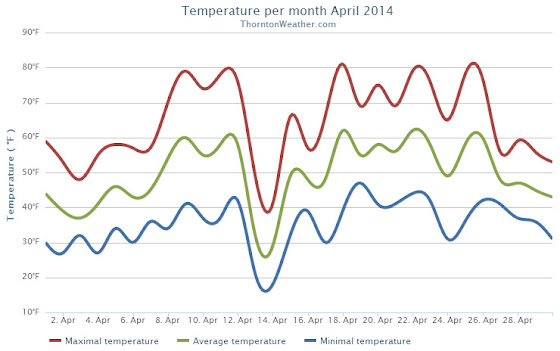
The month of April lacked much in the way of drama for northeastern Colorado. Overall temperatures were warmer than normal and precipitation and snow were lacking a bit.
April started out on the cool side and brought the first snow of the month on the 3rd. By the 8th temperatures had rebounded and we enjoyed a five-day stretch of high temps in the 70s.
A storm system and cold front cooled things down on the 13th and we saw a couple of days of light snowfall. As always the weather bounced back and Thornton recorded its first 80+ degree day of the year on the 18th.
The final four days of the month saw things turn cool again. Some light rain was seen but the bigger story was a period of unusually windy conditions.
Denver’s average April temperature is 47.4 degrees (1981 – 2010). For April 2014, the average temperature in Thornton was more than two degrees higher at 49.6 degrees. Out at Denver International Airport, the average came in a bit cooler at 49.0 degrees.
Temperatures in Thornton ranged from a high of 81.3 degrees on the 18th down to a low of 17.6 degrees on the 14th. DIA saw its warmest reading of 80 degrees on the 22nd and its coldest of 18 degrees on the 14th.
Low temperatures dropped below freezing on 11 days in Thornton. No readings below zero were recorded.
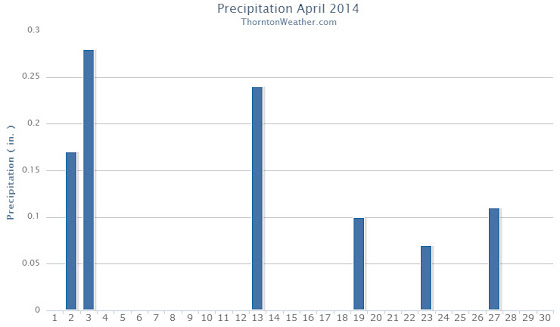
In terms of precipitation, Thornton measured 0.97 inch in the bucket. This is a good ways below the Denver April average of 1.71 inches. DIA saw more precipitation than us with a reading of 1.24 inches.
Similarly, snowfall fell short of normal in Thornton and Denver. On average the Mile High City sees 6.8 inches in April. Thornton recorded only 5.5 inches and DIA 5.6 inches.
April 2014 Temperature Summary for Thornton, Colorado. (ThorntonWeather.com)April 2014 Precipitation Summary for Thornton, Colorado. (ThorntonWeather.com)
CLIMATE REPORT
NATIONAL WEATHER SERVICE BOULDER, CO
603 AM MDT THU MAY 1 2014

...................................

...THE DENVER CO CLIMATE SUMMARY FOR THE MONTH OF APRIL 2014...

CLIMATE NORMAL PERIOD 1981 TO 2010
CLIMATE RECORD PERIOD 1872 TO 2014

WEATHER         OBSERVED          NORMAL  DEPART  LAST YEAR`S
                 VALUE   DATE(S)  VALUE   FROM    VALUE  DATE(S)
                                          NORMAL
................................................................
TEMPERATURE (F)
RECORD
 HIGH              90   04/30/1992
 LOW               -2   04/02/1975
HIGHEST            80   04/22        90     -10       80  04/29
LOWEST             18   04/14        -2      20        6  04/10
AVG. MAXIMUM     62.8              61.5     1.3     54.7
AVG. MINIMUM     35.2              33.3     1.9     28.7
MEAN             49.0              47.4     1.6     41.7
DAYS MAX >= 90      0               0.0     0.0        0
DAYS MAX <= 32      0               0.3    -0.3        4
DAYS MIN <= 32     10              13.0    -3.0       17
DAYS MIN <= 0       0               0.0     0.0        0
PRECIPITATION (INCHES)
RECORD
 MAXIMUM         8.24   1900
 MINIMUM         0.03   1963
TOTALS           1.24              1.71   -0.47     1.87
DAILY AVG.       0.04              0.06   -0.02     0.06
DAYS >= .01         6               9.1    -3.1       13
DAYS >= .10         5               4.5     0.5        7
DAYS >= .50         0               0.9    -0.9        0
DAYS >= 1.00        0               0.5    -0.5        0
GREATEST
 24 HR. TOTAL    0.48   04/02 TO 04/03              0.50
                                                04/22 TO 04/23
SNOWFALL (INCHES)
TOTAL             5.6               6.8

DEGREE_DAYS
HEATING TOTAL     472               529     -57      690
 SINCE 7/1       5730              5731      -1     5802
COOLING TOTAL       0                 1      -1        0
 SINCE 1/1          0                 1      -1        0

FREEZE DATES
RECORD
 EARLIEST     09/08/1962
 LATEST       06/08/2007
EARLIEST                        10/07
LATEST                          05/05
......................................................

WIND (MPH)
AVERAGE WIND SPEED              12.9
RESULTANT WIND SPEED/DIRECTION   2/299
HIGHEST WIND SPEED/DIRECTION    49/340    DATE  04/29
HIGHEST GUST SPEED/DIRECTION    66/340    DATE  04/29

SKY COVER
POSSIBLE SUNSHINE (PERCENT)   MM
AVERAGE SKY COVER           0.70
NUMBER OF DAYS FAIR            1
NUMBER OF DAYS PC             22
NUMBER OF DAYS CLOUDY          7

AVERAGE RH (PERCENT)     50

WEATHER CONDITIONS. NUMBER OF DAYS WITH
THUNDERSTORM              0     MIXED PRECIP               0
HEAVY RAIN                0     RAIN                       3
LIGHT RAIN                8     FREEZING RAIN              0
LT FREEZING RAIN          0     HAIL                       1
HEAVY SNOW                2     SNOW                       3
LIGHT SNOW                6     SLEET                      0
FOG                       8     FOG W/VIS <= 1/4 MILE      2
HAZE                      1

-  INDICATES NEGATIVE NUMBERS.
R  INDICATES RECORD WAS SET OR TIED.
MM INDICATES DATA IS MISSING.
T  INDICATES TRACE AMOUNT.
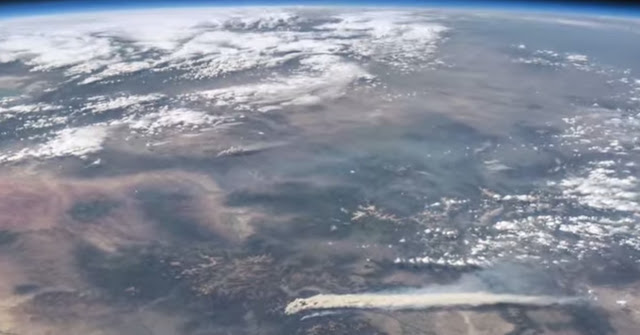
A scene from a new NASA video shows Colorado’s West Fork Fire in June 2013 among other area weather and climate events. (NASA / YouTube)
A stunning video released by NASA this week provides a bird’s eye view of some of the Earth’s most significant weather and climate events of last year.
Using images and movies from satellites and the International Space Station, scenes from across the globe are shown in the video titled “Earth from Orbit 2013.”
Colorado and surrounding states however will draw the most attention from many locally.
From their perch high above, imagery of Colorado’s West Fork Fire in June 2013 is seen as well as the effects of the September floods.
To our south, the drought in New Mexico is seen having taken its toll on Elephant Butte Reservoir in New Mexico. The veritable explosion of storm cells that lea to devastation in Oklahoma during a May tornado outbreak are also shown.
Below the video you will find a description of each scene and links to more imagery.
From NASA – Published on Apr 21, 2014:
A fleet of orbiting satellites monitors Earth constantly. The satellites from NASA and other space agencies give us a fresh, wide perspective on things that we can see from the ground — and things that we can’t.
A look back at Earth in 2013 from the viewpoint of orbit reveals the kind of data gathering and technical achievement that are the reason NASA puts Earth-observing satellites in space. A visualization of satellite and computer model data shows how a cloud of dust from the Chelyabinsk meteor moved around the world. NASA satellites measured the intensity of wildfires, the salinity of the oceans and rainfall around the globe — whether it was too little or too much.
To learn more about NASA’s Earth science in 2014, please visit: www.nasa.gov/earthrightnow
Looking back at the month of March we see a period of relatively uneventful weather in the Denver area. Temperatures were near normal as was the amount of liquid precipitation, this despite the fact we saw well below normal snowfall.
The month started very cold with the first two days failing to record readings above freezing and some light snowfall. That did not last long however and four mild days followed. A weak system then moved in with a couple more shots of snow over a three day period.
Entering the second week of the month temperatures moderated and we saw some of our warmest readings of the month. Light snow on the 12th fell but did not cool things down too much.
Two more very light snowfalls occurred in the last 10 days of the month while temperatures overall remained at or above normal.
Thornton’s average temperature for the month came in at 41.1 degrees, 0.7 degrees above the Denver average for March of 40.4 degrees. Out at Denver International Airport, the Mile High City saw an average monthly temperature of 40.9 degrees.
Our warmest temperature for the month occurred on the 9th when the mercury climbed to 75.0 degrees. The coldest reading of 3.8 degrees happened on March 2. Denver’s warmest and coldest temperatures were on the same days with readings of 73 degrees and 4 degrees.
Two days, the first and the second, saw high temperatures below freezing. Low temperatures below freezing occurred on 22 of the 31 days. Denver saw similar readings.
In terms of liquid precipitation, Thornton recorded 1.06 inches. This was a bit above Denver’s March average of 0.92 inches. Denver was drier than normal recording 0.83 inches.
The near normal precipitation came despite the fact we saw much less snow than normal. March is typically our snowiest with an average of 10.7 inches of the white stuff. Thornton saw a mere 6.5 inches and Denver 6.0 inches.
March 2014 temperature summary for Thornton, Colorado. (ThorntonWeather.com)March 2014 precipitation summary for Thornton, Colorado. (ThorntonWeather.com)
CLIMATE REPORT...CORRECTED
NATIONAL WEATHER SERVICE BOULDER, CO
725 PM MDT TUE APR 1 2014

..............CORRECTED FOR TYPOS FOR THE FOLLOWING.................
.....TEMPERATURES...SNOWFALL DEPARTURES AND PEAK WIND DIRECTION.....

...................................

...THE DENVER CO CLIMATE SUMMARY FOR THE MONTH OF MARCH 2014...

CLIMATE NORMAL PERIOD 1981 TO 2010
CLIMATE RECORD PERIOD 1872 TO 2014

WEATHER         OBSERVED          NORMAL  DEPART  LAST YEAR`S
                 VALUE   DATE(S)  VALUE   FROM    VALUE  DATE(S)
                                          NORMAL
................................................................
TEMPERATURE (F)
RECORD
 HIGH              84   03/26/1971
 LOW              -11   03/28/1886
HIGHEST            73   03/09        84     -11       76  03/15
LOWEST              4   03/02       -11      15        2  03/25
AVG. MAXIMUM     55.8              54.4     1.4     50.7
AVG. MINIMUM     25.9              26.4    -0.5     24.6
MEAN             40.9              40.4     0.5     37.7
DAYS MAX >= 90      0               0.0     0.0        0
DAYS MAX <= 32      2               1.9     0.1        3
DAYS MIN <= 32     23              23.6    -0.6       24
DAYS MIN <= 0       0               0.1    -0.1        0
PRECIPITATION (INCHES)
RECORD
  MAXIMUM         4.56   1983
  MINIMUM         0.03   2012
TOTALS           0.83              0.92   -0.09     1.47
DAILY AVG.       0.03              0.03    0.00     0.05
DAYS >= .01         9               5.9     3.1        6
DAYS >= .10         2               2.4    -0.4        4
DAYS >= .50         0               0.3    -0.3        0
DAYS >= 1.00        0               0.1    -0.1        0
GREATEST
 24 HR. TOTAL    0.32   03/07 TO 03/07           03/22 TO 03/22
                                                          03/22 TO 03/22
                                                          03/22 TO 03/22
 STORM TOTAL       MM                                 MM
 (MM/DD(HH))            MM                    03/22(00) TO 03/22(00)
                                                 03/22(00) TO 03/22(00)2
                                                 03/22(00) TO 03/22(00)2

SNOWFALL (INCHES)
RECORDS
 TOTAL             MM   5
TOTALS            6.0              10.7

DEGREE_DAYS
HEATING TOTAL     739               763     -24      840
 SINCE 7/1       5258              5202      56     5112
COOLING TOTAL       0                 0       0        0
 SINCE 1/1          0                 0       0        0

FREEZE DATES
RECORD
 EARLIEST     09/08/1962
 LATEST       06/08/2007
EARLIEST                        10/07
LATEST                          05/05
...................................................

WIND (MPH)
AVERAGE WIND SPEED              11.5
RESULTANT WIND SPEED/DIRECTION   3/247
HIGHEST WIND SPEED/DIRECTION    45/350    DATE  03/18
HIGHEST GUST SPEED/DIRECTION    55/350    DATE  03/18

SKY COVER
POSSIBLE SUNSHINE (PERCENT)   MM
AVERAGE SKY COVER           0.60
NUMBER OF DAYS FAIR            6
NUMBER OF DAYS PC             18
NUMBER OF DAYS CLOUDY          7

AVERAGE RH (PERCENT)     50

WEATHER CONDITIONS. NUMBER OF DAYS WITH
THUNDERSTORM              0     MIXED PRECIP               0
HEAVY RAIN                0     RAIN                       2
LIGHT RAIN                3     FREEZING RAIN              0
LT FREEZING RAIN          1     HAIL                       0
HEAVY SNOW                0     SNOW                       6
LIGHT SNOW               10     SLEET                      0
FOG                      12     FOG W/VIS <= 1/4 MILE      5
HAZE                      5

-  INDICATES NEGATIVE NUMBERS.
R  INDICATES RECORD WAS SET OR TIED.
MM INDICATES DATA IS MISSING.
T  INDICATES TRACE AMOUNT.
April marks a transition between winter and summer for most of the country but for Denver it is especially true as we can see a stunning variety of weather.
The proverbial April showers are certainly a possibility for Denver. Snow? Tornadoes? Thunderstorms? You bet – all can happen!
For good measure throw in a chance for hail and even dust storms and April gives every type of weather condition you could like – or hate.
Satellite imagery provides bird’s eye view of Earth at the change of seasons.
Pretty neat imagery and explanation from NASA:
Enjoy the Equinox!
Every year, there are two equinoxes. One is in March; the other is in September. In 2014, the March equinox falls on March 20, 2014. On the equinoxes, the sun shines directly on the equator and the length of day and night is nearly equal. Seasons are opposite on either side of the equator, so the March equinox is called the spring (or vernal) equinox in the northern hemisphere. But in the southern hemisphere, it’s known as the fall (autumnal) equinox. What do equinoxes look like from space? The Spinning Enhanced Visible and Infrared Imager (SEVIRI) on EUMETSAT’s Meteosat-9 captured these four views of Earth from geosynchronous orbit. The images show how sunlight fell on the Earth on December 21, 2010 (upper left), and March 20 (upper right), June 21 (lower left), and September 20, 2011 (lower right). Each image was taken at 6:12 a.m. local time. Notice how on March 20 and September 20, the terminator — the divide between day and night — is a straight north-south line, and the Sun is said to sit directly above the equator. Equinox means “equal night” in Latin, capturing the idea that daytime and nighttime are equal lengths everywhere on the planet.
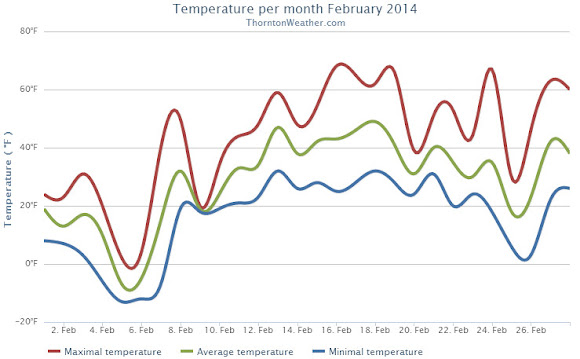
Like all months in Colorado, February 2014 did have some warm periods but those were few and far between as compared to the cold we experienced. Those cold temperatures did not translate to precipitation however.
The month started out quite cold with 9 out of the first 10 days seeing below normal temperatures. Two of those days saw ‘high’ temperatures only in the single digits. Seven of those 10 days stayed below freezing and four saw low temperatures below zero.
Warmer weather courtesy of downslope flow did finally arrive and most of the rest of the month was warmer than average. Of the last 18 days of the month, only two had below normal temperatures.
Overall Thornton’s monthly average temperature for February 2014 was 28.5 degrees. This was four degrees below Denver’s February average of 32.5 degrees. Officially Denver’s average for the month was close to ours at 28.2 degrees.
While clearly a cold month, February 2014 failed to reach ‘top 10 coldest February’ status. Number 10 on that list is February 1905 with an average temperature of 25.2 degrees. The coldest February was in 1899 with an average of 17.6 degrees.
Temperatures ranged from a high of 68.3 degrees on the 16th down to a low of -12.6 degrees on the morning of the 5th. Out at the airport, Denver saw its highest temperature of 68 degrees and its lowest of -19 degrees on the same dates.
Denver record low maximum temperatures on the 5th and 6th. High temperatures on those days were minus 1 degree and plus 1 degree respectively.
Thornton recorded a mere 0.17 inches of precipitation in the rain bucket during the month. Denver officially saw 0.19 inches. Both fall well short of the February average of 0.37 inches. While dry, it wasn’t dry enough to be one of the top 10 driest Februarys.
In terms of snowfall, Thornton measured 4.7 inches. Denver lagged with only 3.3 inches. Again, both were a good ways below the historical Denver average of 5.7 inches.
Thornton, Colorado February 2014 temperature summary. (ThorntonWeather.com)Add a Caption Thornton, Colorado February 2014 temperature summary. (ThorntonWeather.com)Thornton, Colorado February 2014 precipitation summary. (ThorntonWeather.com)
CLIMATE REPORT
NATIONAL WEATHER SERVICE BOULDER, CO
628 AM MST SAT MAR 1 2014

...................................

...THE DENVER CO CLIMATE SUMMARY FOR THE MONTH OF FEBRUARY 2014...

CLIMATE NORMAL PERIOD 1981 TO 2010
CLIMATE RECORD PERIOD 1872 TO 2014

WEATHER         OBSERVED          NORMAL  DEPART  LAST YEAR`S
                 VALUE   DATE(S)  VALUE   FROM    VALUE  DATE(S)
                                          NORMAL
................................................................
TEMPERATURE (F)
RECORD
 HIGH              77   02/28/2006
                        02/04/1890
 LOW              -25   02/01/1951
                        02/08/1936
HIGHEST            68   02/16        77      -9       63  02/17
LOWEST            -19   02/05       -25       6        5  02/22
AVG. MAXIMUM     42.3              46.2    -3.9     43.3
AVG. MINIMUM     14.1              18.9    -4.8     16.9
MEAN             28.2              32.5    -4.3     30.1
DAYS MAX >= 90      0               0.0     0.0        0
DAYS MAX <= 32      8               3.9     4.1        6
DAYS MIN <= 32     26              26.9    -0.9       28
DAYS MIN <= 0       5               1.3     3.7        0

PRECIPITATION (INCHES)
RECORD
 MAXIMUM         2.01   1934
 MINIMUM         0.01   1970
TOTALS           0.19              0.37   -0.18     0.77
DAILY AVG.       0.01              0.01    0.00     0.03
DAYS >= .01         4               5.3    -1.3        6
DAYS >= .10         1               0.7     0.3        4
DAYS >= .50         0               0.0     0.0        0
DAYS >= 1.00        0               0.0     0.0        0
GREATEST
 24 HR. TOTAL    0.12   02/04 TO 02/04              0.43
                                                 02/24 TO 02/24
 STORM TOTAL      2.3                                9.1
 (MM/DD(HH))            02/04 TO 02/04           02/24 TO 02/24

 SNOWFALL (INCHES)
RECORDS
 TOTAL           22.1   02-1912
 TOTAL            3.3   02-2014     5.7 1980-2010

DEGREE_DAYS
HEATING TOTAL    1022               908     114      972
 SINCE 7/1       4519              4439      80     4272
COOLING TOTAL       0                 0       0        0
 SINCE 1/1          0                 0       0        0

FREEZE DATES
RECORD
 EARLIEST     09/08/1962
 LATEST       06/08/2007
EARLIEST                        10/07
LATEST                          05/05
.....................................................

WIND (MPH)
AVERAGE WIND SPEED              10.5
RESULTANT WIND SPEED/DIRECTION   2/270
HIGHEST WIND SPEED/DIRECTION    48/270    DATE  02/16
HIGHEST GUST SPEED/DIRECTION    59/270    DATE  02/16

SKY COVER
POSSIBLE SUNSHINE (PERCENT)   MM
AVERAGE SKY COVER           0.60
NUMBER OF DAYS FAIR            2
NUMBER OF DAYS PC             18
NUMBER OF DAYS CLOUDY          8

AVERAGE RH (PERCENT)     63

WEATHER CONDITIONS. NUMBER OF DAYS WITH
THUNDERSTORM              0     MIXED PRECIP               0
HEAVY RAIN                0     RAIN                       0
LIGHT RAIN                1     FREEZING RAIN              0
LT FREEZING RAIN          0     HAIL                       0
HEAVY SNOW                0     SNOW                       1
LIGHT SNOW               10     SLEET                      0
FOG                      19     FOG W/VIS <= 1/4 MILE      8
HAZE                     12

-  INDICATES NEGATIVE NUMBERS.
R  INDICATES RECORD WAS SET OR TIED.
MM INDICATES DATA IS MISSING.
T  INDICATES TRACE AMOUNT.
The past two months have brought periods of extreme cold but not a lot of snow to Denver. March however is our snowiest month and may bring a turnaround in those numbers. It also typically brings much warmer temperatures.
March is historically Denver’s snowiest month and brings about 20% of our annual snowfall. Heavy, wet spring snow storms can oftentimes bring the entire month’s snowfall total in one monstrous snow.
We also start the transition to spring and severe weather season and the month typically brings our first thunderstorms of the year. Temperatures climb throughout the month and by the end our average daytime highs are near 60 degrees.
NASA’s Atmospheric Infrared Sounder (AIRS) instrument on NASA’s Aqua spacecraft shows the cold air pushed down from the Arctic in January 2014. (NASA)
Unseasonably cold weather gripped much of the nation in January and brought a term to public’s consciousness they may not have heard before: polar vortex. As explained in a video from NASA, the ‘stretching’ of the vortex was responsible for the record-setting cold seen last month.
NASA writes:
This movie of temperature observations from NASA’s Atmospheric Infrared Sounder (AIRS) instrument on NASA’s Aqua spacecraft depicts the first major North American weather event of 2014: cold air moving out of the Arctic and south to cover much of the continent. The temperatures shown are at a pressure of 850 hectopascals (hPa, formerly knows as millibars; sea level pressure is normally around 1000 hPa). Pressures of 850 hPa correspond to an altitude of about 3,000 feet (1 kilometer) above sea level. The temperatures in the movie range from about minus 18 degrees Fahrenheit (245 Kelvin or minus 28 degrees Celsius) to warmer than 66 degrees Fahrenheit (290 Kelvin or about 17 degrees Celsius). The very coldest temperatures in purples and blues are minus 18 to 17 degrees Fahrenheit (minus 28 to about minus 8 degrees Celsius).
The most obvious feature of the movie is the tongue of cold air moving out of Canada and southward to cover much of the eastern United States during early January 2014. This event was covered extensively in the media, and introduced the term ‘polar vortex’ to a broader audience.
This global perspective illustrates some features not noted in all the recent media attention. Perhaps most obvious: this is not a global phenomenon. The eastern half of the United States includes only about one percent of the total surface area of the planet (about two million of 197 million square miles). One advantage of satellite observations, as from AIRS, is coverage of the entire planet. A truly global perspective is required when studying variations in climate, and this event must be compared against a number of other phenomena occurring around the planet. Note that Alaska and northern Eurasia were warm during this period of unusual cold over the eastern United States.
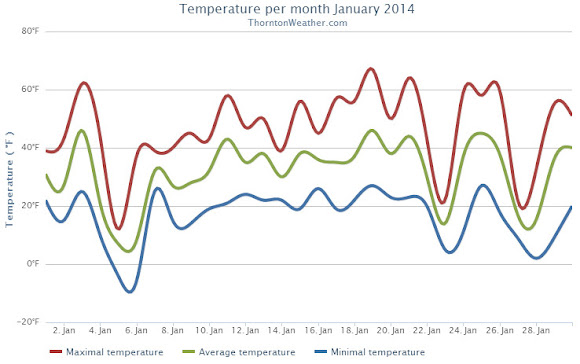
January 2014 could be remembered as a month that brought a weather rollercoaster. Looking back it seems as if we were constantly jumping between mild temperatures to cold to warmth and back to cold again.
The month started out cooler than normal for the first two days with a light shot of snow on New Year’s Day. Temperatures then shot into the 60s on the 3rd but were followed by colder temperatures and more snow on the 4th. On the 5th we registered our coldest day of the month.
From the 7th to the 16th we experienced relatively calm conditions and only very light snow on one day. We saw above normal temperatures from the 15th to the 21st. Two cold days followed with snow falling on the 23rd.
Alternating above-normal and below-normal temperatures closed out the month. Four of the last five days saw snowfall.
Thornton recorded an average monthly temperature of 31.3 degrees. This was slightly higher than Denver’s official recording of 31.2 degrees. Both were slightly above the historical average January temperature of 30.7 degrees.
Temperatures in Thornton ranged from a high of 67.0 degrees on the 19th down to a low of -5.5 degrees on the 6th. Denver’s warmest temperature of 65 degrees also occurred on the 19th and it recorded its coldest of -10 degrees on the 5th.
All 31 days of the month saw low temperatures below freezing in Thornton and four days saw high temperatures fail to reach 32 degrees. Two days saw readings below zero. Denver’s readings were similar with four days staying below freezing and three seeing lows below zero.
Precipitation for the month was nearly double of the Denver historical average thanks to snowfall that was about double of normal.
Thornton recorded 1.06 inch of liquid precipitation, well above the average of 0.41 inch. Denver saw a bit less with 0.94 inch.
While no major snowstorms were seen, there were plenty of smaller events. These gave Thornton 13.4 inches of the white stuff during the month, Denver saw 14.3 inches. Both were about double the January average of 7.1 inches. The official Denver measurement propelled January 2014 into the books as the 11th snowiest January on record.
Thornton, Colorado January 2014 temperature summary.Thornton, Colorado January 2014 precipitation summary.
CLIMATE REPORT
NATIONAL WEATHER SERVICE BOULDER, CO
517 AM MST SAT FEB 1 2014

...................................

...THE DENVER CO CLIMATE SUMMARY FOR THE MONTH OF JANUARY 2014...

CLIMATE NORMAL PERIOD 1981 TO 2010
CLIMATE RECORD PERIOD 1872 TO 2014

WEATHER         OBSERVED          NORMAL  DEPART  LAST YEAR`S
                 VALUE   DATE(S)  VALUE   FROM    VALUE  DATE(S)
                                          NORMAL
................................................................
TEMPERATURE (F)
RECORD
 HIGH              76   01/27/1888
 LOW              -29   01/09/1875
HIGHEST            65   01/19        76     -11       66  01/24
LOWEST            -10   01/05       -29      19      -12  01/12
AVG. MAXIMUM     44.9              44.0     0.9     44.6
AVG. MINIMUM     17.3              17.4    -0.1     16.0
MEAN             31.1              30.7     0.4     30.3
DAYS MAX >= 90      0               0.0     0.0        0
DAYS MAX <= 32      4               5.5    -1.5        6
DAYS MIN <= 32     30              29.4     0.6       30
DAYS MIN <= 0       3               1.7     1.3        5

PRECIPITATION (INCHES)
RECORD
 MAXIMUM         2.35   1883
 MINIMUM         0.01   1933
                        1934
                        1952
TOTALS           0.94              0.41    0.53     0.31
DAILY AVG.       0.03              0.01    0.02     0.01
DAYS >= .01         9               4.1     4.9        4
DAYS >= .10         3               0.9     2.1        1
DAYS >= .50         0               0.0     0.0        0
DAYS >= 1.00        0               0.0     0.0        0
GREATEST
 24 HR. TOTAL    0.26   01/30 TO 01/31           01/28 TO 01/29
                                                          01/29 TO 01/29
                                                          01/29 TO 01/29
 STORM TOTAL       MM                                 MM
 (MM/DD(HH))            MM                    01/29(00) TO 01/29(00)
                                                 01/29(00) TO 01/29(00)9
                                                 01/29(00) TO 01/29(00)9

SNOWFALL (INCHES)
RECORDS
 TOTAL             MM   MM
TOTALS           14.3               7.0

DEGREE_DAYS
HEATING TOTAL    1046              1063     -17     1067
 SINCE 7/1       3497              3531     -34     3300
COOLING TOTAL       0                 0       0        0
 SINCE 1/1          0                 0       0        0

FREEZE DATES
RECORD
 EARLIEST     09/08/1962
 LATEST       06/08/2007
EARLIEST                        10/07
LATEST                          05/05
..........................................................

WIND (MPH)
AVERAGE WIND SPEED              10.7
RESULTANT WIND SPEED/DIRECTION   4/230
HIGHEST WIND SPEED/DIRECTION    36/290    DATE  01/12
HIGHEST GUST SPEED/DIRECTION    44/280    DATE  01/12

SKY COVER
POSSIBLE SUNSHINE (PERCENT)   MM
AVERAGE SKY COVER           0.50
NUMBER OF DAYS FAIR           10
NUMBER OF DAYS PC             14
NUMBER OF DAYS CLOUDY          7

AVERAGE RH (PERCENT)     56

WEATHER CONDITIONS. NUMBER OF DAYS WITH
THUNDERSTORM              0     MIXED PRECIP               0
HEAVY RAIN                0     RAIN                       0
LIGHT RAIN                0     FREEZING RAIN              0
LT FREEZING RAIN          0     HAIL                       0
HEAVY SNOW                2     SNOW                       5
LIGHT SNOW               11     SLEET                      0
FOG                      11     FOG W/VIS <= 1/4 MILE      4
HAZE                      4

-  INDICATES NEGATIVE NUMBERS.
R  INDICATES RECORD WAS SET OR TIED.
MM INDICATES DATA IS MISSING.
T  INDICATES TRACE AMOUNT.
Weather, natural disasters & climate news and information.