Thursday and Friday brought the hottest temperatures ever recorded during the month of September. Saturday we were spared making that mark again but we did tie a record.
The mercury at Denver International Airport topped out at 95 degrees at 3:07 p.m. This tied the record high temperature for the date of September 7th established in 1933.
Thornton saw very similar conditions to the airport. Our thermometer hit a high of 95.6 degrees.
This was the third record-setting day in a row for the Mile High City and every day so far this month except one (the 1st) has been punctuated by temperature exceeding 90 degrees.
Don’t miss a thing when it comes to our ever-changing weather! Be sure to ‘like’ us on Facebook, follow us on Twitter and add us to your Google+ circles.
For the second day in a row Denver’s temperature officially topped out at 97 degrees as measured at Denver International Airport smashing records once again.
The hot temperature tied the record for the hottest temperature ever recorded during the month of September, just as it did yesterday. It also sets a new record high for the date of September 6, easily besting the previous record of 95 degrees set in 1959.
Here in Thornton we were hotter than the airport as our temperature topped out at a sweltering 99.0 degrees. This was actually the second hottest temperature Thornton has recorded this year. Only June 11th was hotter at 99.2 degrees.
Don’t miss a thing when it comes to our ever-changing weather! Be sure to ‘like’ us on Facebook, follow us on Twitter and add us to your Google+ circles.
A good bit of cloud cover couldn’t keep the mercury from rising to mid-summer-like levels today. The hot temperatures in fact tied two records.
Denver’s temperature topped out a 97 degrees as measured at Denver International Airport. This tied the record high temperature for the date of September 5 set in 1899.
This also tied the record for the hottest temperature ever recorded during the month of September. The 97 degree mark has been recorded multiple times during the month, always within the first five days.
Here in Thornton the temperature we were actually a bit warmer than DIA, a rarity. We topped out at 98 degrees (97.6 degrees).
Unfortunately we will see no break in the 90+ degree weather until Monday at the earliest.
Don’t miss a thing when it comes to our ever-changing weather! Be sure to ‘like’ us on Facebook, follow us on Twitter and add us to your Google+ circles.
Recent weeks have delivered a number of hot days with temperatures routinely a good ways above normal. With the arrival of September 1 and the start of the meteorological fall, most in the Mile High City are hoping for some relief.
As temperatures start to drop, September usually reminds us that summer is at an end and fall is now here. Sunshine is predominant though as the month actually has the highest percentage of sun out of any month. Sunny days and clear, cool nights are the standard weather pattern for the month.
Current indications are that through the first half of the month temperatures are going to remain unseasonably warm. Precipitation-wise, we expect to see normal levels.
Looking back at last month we certainly do recall the unseasonably warm temperatures that seemed to dominate August 2013. While the high temperatures were indeed high, somehow Thornton managed to end up with a relatively average temperature and precipitation short of normal.
The month started with temperatures into the 90s and much-needed precipitation on two of the first three days. Thunderstorms on the third provided a bit of excitement including strong winds and some hail.
From there the month turned a good bit cooler with seasonal temperatures on many days and even two days (the 7th and 8th) when highs were in the 70s. The latter half of the month however saw a return of the heat with 13 of the final 16 days of the month registering high temperatures at or above 90 degrees.
Looking at the statistics one can easily see how different weather conditions can be across a relatively small area. While Thornton saw a monthly average temperature near normal, Denver was considerably warm. Similarly, our precipitation was below the Denver long term average but out at the airport it was well above average.
In terms of temperatures, the August average temperature in Thornton was 72.0 degrees. This was right near the 1981 to 2010 Denver average for the month of 72.5 degrees. Out at DIA however, the average temperature was a considerably higher 74.6 degrees.
Thornton’s highest temperature of the month was 97.6 degrees on the 20th. Our lowest was 50.2 degrees on the 15th. Officially, Denver’s highest temperature recorded was 99 degrees on the 20th and its lowest 52 degrees on that same day.
Three temperature records were broken in Denver during August 2013.
A new record high of 97 degrees was recorded on August 17 (96 degrees, 1994). On August 20 a record high of 99 degrees was recorded as well (98 degrees, 1987). Also on the 20th, a record high minimum of 70 degrees was set (67 degrees, 2007).
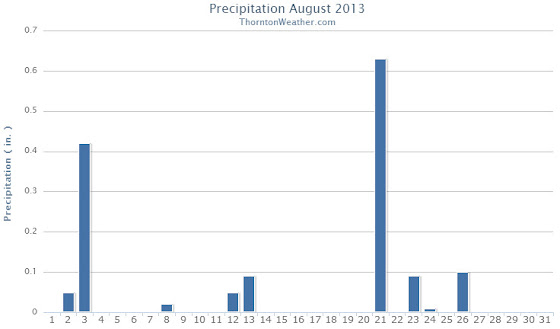
Denver’s long term precipitation for the month of August is 1.69 inches. Thornton fell short of that mark as we registered 1.37 inches in our rain bucket. More than an inch of that was the result of thunderstorms on two days (the 3rd and the 21st).
Denver was able to best us by a large margin recording 2.78 inches of precipitation in August 2013. The bulk of the Mile High City’s precipitation fell on the 22nd when they registered 1.94 inches from a slow moving thunderstorm, one which missed Thornton entirely.
One precipitation record was set in Denver during August 2013. The 1.94 inches of rainfall on the 22nd was a record for the date, easily besting the old record of 0.75 inches set in 1953.
Thornton, Colorado August 2013 Temperatures.Thornton, Colorado August 2013 Precipitation.
...THE DENVER CO CLIMATE SUMMARY FOR THE MONTH OF AUGUST 2013...

CLIMATE NORMAL PERIOD 1981 TO 2010
CLIMATE RECORD PERIOD 1872 TO 2013

WEATHER         OBSERVED          NORMAL  DEPART  LAST YEAR`S
                 VALUE   DATE(S)  VALUE   FROM    VALUE  DATE(S)
                                          NORMAL
................................................................
TEMPERATURE (F)
RECORD
 HIGH             105   08/08/1878
 LOW               40   08/26/1910
                        08/25/1910
                        08/24/1910
HIGHEST            99   08/20       105      -6       98  08/27
                                                          08/03
                                                          08/06
LOWEST             52   08/09        40      12       47  08/17
AVG. MAXIMUM     89.4              87.2     2.2     91.0
AVG. MINIMUM     59.8              57.9     1.9     58.9
MEAN             74.6              72.5     2.1     75.0
DAYS MAX >= 90     16              11.5     4.5       20
DAYS MAX <= 32      0               0.0     0.0        0
DAYS MIN <= 32      0               0.0     0.0        0
DAYS MIN <= 0       0               0.0     0.0        0

PRECIPITATION (INCHES)
RECORD
 MAXIMUM         5.85   1979
 MINIMUM         0.02   1924
TOTALS           2.78              1.69    1.09     0.11
DAILY AVG.       0.09              0.05    0.04     0.00
DAYS >= .01         7               8.6    -1.6        1
DAYS >= .10         2               4.3    -2.3        1
DAYS >= .50         2               1.2     0.8        0
DAYS >= 1.00        1               0.3     0.7        0
GREATEST
 24 HR. TOTAL    1.95   08/21 TO 08/22           08/11 TO 08/11
                                                          08/10 TO 08/11
                                                          08/11 TO 08/11
 STORM TOTAL       MM                                 MM
 (MM/DD(HH))            MM                    08/11(00) TO 08/11(00)
                                                 08/11(00) TO 08/11(00)1
                                                 08/11(00) TO 08/11(00)1

SNOWFALL (INCHES)
RECORDS
 TOTAL             MM   MM
TOTALS            0.0               0.0

DEGREE_DAYS
HEATING TOTAL       0                10     -10        0
 SINCE 7/1          0                16     -16        0
COOLING TOTAL     308               244      64      319
 SINCE 1/1        866               688     178     1122

FREEZE DATES
RECORD
 EARLIEST     09/08/1962
 LATEST       06/08/2007
EARLIEST                        10/07
LATEST                          05/05
..................................................

WIND (MPH)
AVERAGE WIND SPEED              8.8
RESULTANT WIND SPEED/DIRECTION   3/204
HIGHEST WIND SPEED/DIRECTION    43/110    DATE  08/03
HIGHEST GUST SPEED/DIRECTION    55/060    DATE  08/03

SKY COVER
POSSIBLE SUNSHINE (PERCENT)   MM
AVERAGE SKY COVER           0.60
NUMBER OF DAYS FAIR            4
NUMBER OF DAYS PC             23
NUMBER OF DAYS CLOUDY          4

AVERAGE RH (PERCENT)     48

WEATHER CONDITIONS. NUMBER OF DAYS WITH
THUNDERSTORM              0     MIXED PRECIP               0
HEAVY RAIN                2     RAIN                       3
LIGHT RAIN               11     FREEZING RAIN              0
LT FREEZING RAIN          0     HAIL                       0
HEAVY SNOW                0     SNOW                       0
LIGHT SNOW                0     SLEET                      0
FOG                       4     FOG W/VIS <= 1/4 MILE      2
HAZE                     10

-  INDICATES NEGATIVE NUMBERS.
R  INDICATES RECORD WAS SET OR TIED.
MM INDICATES DATA IS MISSING.
T  INDICATES TRACE AMOUNT.
While there has been no shortage of heat, we have avoided any records for the past two weeks – until Tuesday.
Yesterday the coldest temperature registered at Denver International Airport during the 24 hour period was only 68 degrees. This sets a new record high minimum for September 3, breaking the old record of 67 degrees set in 1947.
Here in Thornton we were a bit cooler with a low of 66 degrees at 6:44am.
The hot weather will continue through the weekend before we may see at least a bit of relief. The ridge is expected to start to break down Tuesday ushering cooler temperatures, particularly on Wednesday. Keep an eye on the forecast here for details.
Don’t miss a thing when it comes to our ever changing weather! Be sure to ‘like’ us on Facebook, follow us on Twitter and add us to your Google+ circles.
This year on September 3 Denver reached an official high temperature of 94 degrees. Here in Thornton we topped out at 95 degrees.
Providing a stark contrast is a look back at this date 52 years ago.
On September 3, 1961 a winter-like system delivered 4.2 inches of snow to the Mile High City with the foothills receiving a foot of the white stuff. This is the earliest date for a seasonal snowfall on record. Temperatures that day dropped to 33 degrees, the earliest in the season it has ever been that cold.
The comparison highlights the extremes that Colorado can experience in September (much like most other months). Which would you prefer? Heat or snow?
Progress battling the massive Rim Fire has been slow to come and while some gains have been made, the blaze continued to grow and now encompasses more than 280 square miles. The blaze has already intruded on Yosemite National Park and were perilously close to its infamous giant sequoia trees. Park officials were placing sprinklers in two groves of sequoias not far from the fire.
A firefighter uses a hose to douse the flames of the Rim Fire on August 24, 2013 near Groveland, California. (Getty Images) Click the image to view a slideshow from the Rim Fire.
Former vice president Al Gore has made more than his fair share of misstatements while acting as the most visible spokesperson for climate change alarmism. In his latest, Gore makes a false claim that hurricanes are becoming so strong that a new Category 6 classification is coming. Read more about the former VP’s latest misstep on Examiner.com
Mother Nature can be fickle, especially in Colorado, dropping heavy rain in one location and nothing in a spot nearby. Such was the case this afternoon and evening when Denver International Airport received nearly two inches of rain and Thornton recorded nothing.
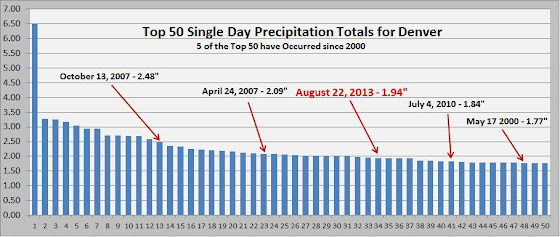
As officially measured at DIA, Denver recorded an amazing 1.94 inches of precipitation on August 22. This easily bests the record for the date of 0.75 inches set in 1953. It also ranks as the 34th biggest single day precipitation total for the city on record.
Here in Thornton we weren’t so lucky as the storms stayed south and east of us. We recorded absolutely nothing in the rain bucket on this date.
Denver’s Top 50 Single Day Precipitation Totals (National Weather Service)
Weather, natural disasters & climate news and information.
 Thursday and Friday brought the hottest temperatures ever recorded during the month of September. Saturday we were spared making that mark again but we did tie a record.

")