A fast-moving storm brought a quick shot of snow to the Denver metro area on Veterans Day. This time lapse video captures the snow just as it starts at 1:00am on November 11, 2015 and runs until 1:00pm that same day but which time the sun had come out and the snow was quickly melting. Thornton, Colorado recorded 4.1 inches from the storm.
Category Archives: Thornton Weather
October 2015 weather recap: Warmer and wetter than normal

Thornton’s October was an unusually warm one with daytime highs more what we would expect in September. It would also have been a dry one were it not for three days of healthy rainfall in the latter third of the month.
The overall average temperature for the month in Thornton was 54.4 degrees. Out at Denver International Airport where Denver’s official readings are taken, the average was a good bit warmer at 56.5 degrees. The 30 year historical average for October is 50.9 degrees so both locations were considerably warmer than normal.
Temperatures in Thornton ranged from a maximum of 86.8 degrees on the 11th down to 30.5 degrees on the morning of the 28th. Denver’s high and low came on the same dates at 87 degrees and 28 degrees respectively. The high reading on the 11th was a record high for the date.
In terms of precipitation, 1.54 inches fell in Thornton’s rain bucket. Denver bested us with 1.76 inches. Both beat the October average of 1.02 inches.
Snowfall was non-existent during the month. On average the Mile High City sees 4.0 inches of the white stuff in October.
Click here to view Thornton’s October 2015 climate report.


From the National Weather Service:
CLIMATE REPORT
NATIONAL WEATHER SERVICE BOULDER, CO
315 PM MST SUN NOV 1 2015

...................................

...THE DENVER CO CLIMATE SUMMARY FOR THE MONTH OF OCTOBER 2015...

CLIMATE NORMAL PERIOD 1981 TO 2010
CLIMATE RECORD PERIOD 1872 TO 2015

WEATHER         OBSERVED          NORMAL  DEPART  LAST YEAR`S
                 VALUE   DATE(S)  VALUE   FROM    VALUE  DATE(S)
                                          NORMAL
................................................................
TEMPERATURE (F)
RECORD
 HIGH              90   10/01/1892
 LOW               -2   10/29/1917
HIGHEST            87   10/11        83       4       83  10/15
LOWEST             28   10/28        22       6       29  10/27
AVG. MAXIMUM     70.1              65.3     4.8     69.5
AVG. MINIMUM     42.8              36.6     6.2     40.7
MEAN             56.5              50.9     5.6     55.1
DAYS MAX >= 90      0               0.0     0.0        0
DAYS MAX <= 32      0               0.4    -0.4        0
DAYS MIN <= 32      1               8.5    -7.5        4
DAYS MIN <= 0 0 0.0 0.0 0
PRECIPITATION (INCHES)
RECORD
 MAXIMUM 4.17 1969
 MINIMUM T 1934
TOTALS 1.76 1.02 0.74 0.52
DAILY AVG. 0.06 0.03 0.03 0.02
DAYS >= .01         6               5.3     0.7        5
DAYS >= .10         3               2.4     0.6        2
DAYS >= .50         2               0.5     1.5        0
DAYS >= 1.00        0               0.1    -0.1        0
GREATEST
 24 HR. TOTAL    0.87   10/20 TO 10/21

SNOWFALL (INCHES)
 TOTAL            0.0               4.0
RECORD OCTOBER   31.2                                   1969

DEGREE_DAYS
HEATING TOTAL     274               440    -166      299
 SINCE 7/1        301               581    -280      394
COOLING TOTAL      16                 5      11        0
 SINCE 1/1        877               769     108      701

FREEZE DATES
RECORD
 EARLIEST     09/08/1962
 LATEST       06/08/2007
EARLIEST      10/28             10/07
LATEST                          05/05
..................................................

WIND (MPH)
AVERAGE WIND SPEED              8.8
RESULTANT WIND SPEED/DIRECTION   2/203
HIGHEST WIND SPEED/DIRECTION    29/010    DATE  10/27
HIGHEST GUST SPEED/DIRECTION    40/160    DATE  10/02

SKY COVER
POSSIBLE SUNSHINE (PERCENT)   MM
AVERAGE SKY COVER           0.60
NUMBER OF DAYS FAIR            6
NUMBER OF DAYS PC             15
NUMBER OF DAYS CLOUDY         10

AVERAGE RH (PERCENT)     53

WEATHER CONDITIONS. NUMBER OF DAYS WITH
THUNDERSTORM              2     MIXED PRECIP               0
HEAVY RAIN                0     RAIN                       3
LIGHT RAIN                6     FREEZING RAIN              0
LT FREEZING RAIN          0     HAIL                       0
HEAVY SNOW                0     SNOW                       0
LIGHT SNOW                0     SLEET                      0
FOG                       9     FOG W/VIS <= 1/4 MILE      3
HAZE                      6

-  INDICATES NEGATIVE NUMBERS.
R  INDICATES RECORD WAS SET OR TIED.
MM INDICATES DATA IS MISSING.
T  INDICATES TRACE AMOUNT.
November preview: Second snowiest month can bring a lot of variety
 The weather during the month of November in Denver metro area can offer just about anything. While it is normally a quiet month, it can be prone to extremes.
November is Denver’s second snowiest month and major snowstorms are not entirely uncommon. However conditions can also be quite dry.
Temperatures during the month continue to cool as we get closer to winter and by the end of the month the low temperatures routinely dip to 20 degrees or below. At times it can in fact bring conditions more like what we see in January.
Get all the details on November’s weather and what we can expect in our complete preview here.
October 2015 top shots: Monthly photo slideshow

October in Thornton can bring a wide variety of weather conditions, perfect for the photographer in all of us.
The month brings the changing of the colors at Colorado’s lower elevations and it is also is typically when we see our first freeze and first snow.
Couple those facts with our usual widely varying landscapes and wildlife and we have a month that is sure to bring in plenty of photo opportunities.
- Slideshow updated November 1, 2015
- To learn more about how to send your photo to us for inclusion in the slideshow, see below the slideshow.
Showcasing images captured by ThorntonWeather.com readers as well as some of our own, our monthly slideshow covers the entire gamut of weather-related imagery.
Sunsets, sunrises, wildlife and of course every type of weather condition are vividly depicted in images captured from yours and our cameras.
| [flickr_set id=”72157659177525310″] |
What is missing in the slideshow above? Your photo!
Our monthly photo slideshow is going to feature images that we have taken but more importantly images that you have captured. The photos can be of anything even remotely weather-related.
Landscapes, current conditions, wildlife, pets, kids. Whimsical, newsy, artsy. Taken at the zoo, some other area attraction, a local park, a national park or your backyard. You name it, we want to see and share it!
Images can be taken in Thornton, Denver or anywhere across the extraordinary Centennial State. We’ll even take some from out of state if we can tie it to Colorado somehow.
We’ll keep the criteria very open to interpretation with just about any image eligible to be shown in our slideshows.
What do you win for having your image in our slideshow? We are just a ‘mom and pop’ outfit and make no money from our site so we really don’t have the means to provide prizes. However you will have our undying gratitude and the satisfaction that your images are shared on the most popular website in Thornton.
To share you images with us and get them included in the slideshow just email them to us or share them with ThorntonWeather.com on any of the various social media outlets. Links are provided below.
So come on, get those camera’s rolling!
- Email: info@ThorntonWeather.com
- Facebook: https://www.facebook.com/ThorntonWeather
- Google+: https://plus.google.com/+Thorntonweather
- Twitter: @ThorntonWeather (https://twitter.com/thorntonweather)
Falling back: Daylight Saving Time comes to an end Sunday morning

The biannual ritual of changing our clocks to adjust for Daylight Saving Time occurs tonight providing yet another signal of the changing of seasons. The United States will ‘fall back’ one hour at 2:00am Sunday morning as we return to Standard Time.
The ritual of changing our clocks twice a year can be met with some resistance as some people struggle to adjust their body’s internal clock. Others actually like the return to standard time as they get to enjoy an extra hour of sleep.
The time change definitely has big effects on the dawning of daylight and how early it gets dark in the evening.
Sunrise on Saturday occurs at 7:27am but on Sunday it will be at 6:28am. Similarly, sunset will occur at 5:59pm on Saturday but on Sunday the sun will disappear over the horizon at 4:58pm.
For many this means that when they get home from work it will now be dark and outdoor activities will be significantly curtailed as a result.
Arizona and Hawaii are the only states that do not observe Daylight Saving Time and remain on Standard Time year round. The U.S. territories of Puerto Rico, American Samoa, Guam, Northern Mariana Islands, and the United States Virgin Islands also do not observe the event.
It won’t be all that long though before Daylight Saving Time returns. On March 13, 2016 we will ‘spring forward.’
Daylight Saving Time Schedule
The mandated beginning and end of Daylight Saving Time has changed in the United States over the years.
The most recent schedule was set by the Energy Policy Act of 2005 and took effect in 2007. We now ‘spring forward’ to begin Daylight Saving Time on the second Sunday in March and ‘fall back’ with the return to Standard Time on the first Sunday in November.
| Year | DST Begins 2 a.m. (Second Sunday in March) |
DST Ends 2 a.m. (First Sunday in November) |
|---|---|---|
| 2015 | 8 March 2015 | 1 November 2015 |
| 2016 | 13 March 2016 | 6 November 2016 |
| 2017 | 12 March 2017 | 5 November 2017 |
| 2018 | 11 March 2018 | 4 November 2018 |
| 2019 | 10 March 2019 | 3 November 2019 |
| 2020 | 8 March 2020 | 1 November 2020 |
| 2021 | 14 March 2021 | 7 November 2021 |
| 2022 | 13 March 2022 | 6 November 2022 |
Happy birthday! ThorntonWeather.com enters 10th year of operation

It is hard to believe but it was on October 25, 2006 the digital switch was thrown and the first bits of live weather data from our weather station were fed to the Internet. ThorntonWeather.com was born!
Since that date, we are extremely proud of what the site has become – an indispensable community resource for north Denver metro area residents, businesses and governmental agencies.
On the one year anniversary of the site’s launch, we were receiving on average 750 unique visitors a month. On the second anniversary that had grown to around 5,000 visitors a month. For 2015 we are on pace to average well over 25,000 per month!
The response has been absolutely overwhelming to say the least.
We launched the site simply because we wanted to know what was going on with the weather in Thornton and the north Denver metro area. We don’t live downtown, we don’t live at DIA and the differences in weather between Thornton and those other locations can be considerable. Apparently many of you agree!
Our site has not only grown in terms of visitors, but perhaps more importantly in terms of the amount of information available. Certainly we provide the basics of live weather conditions, radar and forecasts.
- Did you know ThorntonWeather.com is a completely non-profit venture run by a Thornton resident? We are self-funded but do occasionally receive help from members of the community, something which allows us to keep things up and running. Learn more about how you can help here.
Far more than that, we now have educational information about various weather dangers, historical climate information, satellite imagery, webcams and so much more. Our news and blog section is continually updated with the latest news and information including items important to the community.
Put simply, there is no other media outlet in the state that provides as much weather news, information and content as we do!
Since our launch we have became very ‘social’ with a growing Facebook page, a Twitter feed and a presence on Google +. Interacting with our visitors is an integral part of our site and something we enjoy greatly.
- Stay up to date with Thornton’s weather: Be sure to ‘like’ us on Facebook, follow us on Twitter and add us to your Google+ circles.
We’re just ‘weather geeks’ that love the weather and love our community. Running ThorntonWeather.com can be a bit expensive and it is time consuming to maintain and operate it but it is worth it.
We’d like to thank all of our visitors for your support in the past and we look forward to continuing to be the best, truly local source for Thornton weather.
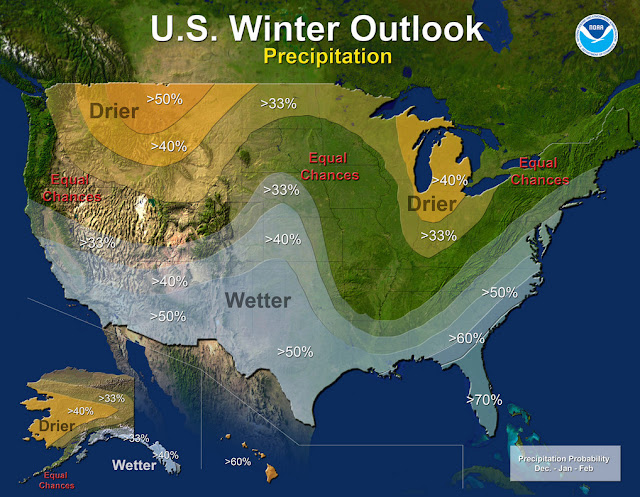
NOAA Winter Outlook: Little clarity as to El Niño’s impact on Thornton

NOAA’s Climate Prediction Center released their 2015-2016 winter outlook this morning and while a strong El Niño will play a factor in some parts of the nation, its effects here are less clear.
As we have written about before, Colorado’s geographical location well inland, shelters it some from the effects of warm, Pacific waters. Overall snowfall in Colorado during El Niño years has not trended greatly one way or another. We have however seen some of our largest storms during El Niño.
NOAA’s outlook shows a pretty typical El Niño situation with some locations of the nation expected to receive copious amounts of moisture. For us, it does point to a bit better chance of a wetter than normal period from December to February.
Read the complete text of NOAA’s outlook below. At the bottom is the video they released to accompany it.
Forecasters at NOAA’s Climate Prediction Center issued the U.S. Winter Outlook today favoring cooler and wetter weather in Southern Tier states with above-average temperatures most likely in the West and across the Northern Tier. This year’s El Niño, among the strongest on record, is expected to influence weather and climate patterns this winter by impacting the position of the Pacific jet stream.
“A strong El Niño is in place and should exert a strong influence over our weather this winter,” said Mike Halpert, deputy director, NOAA’s Climate Prediction Center. “While temperature and precipitation impacts associated with El Niño are favored, El Niño is not the only player. Cold-air outbreaks and snow storms will likely occur at times this winter. However, the frequency, number and intensity of these events cannot be predicted on a seasonal timescale.”
Other factors that often play a role in the winter weather include the Arctic Oscillation, which influences the number of arctic air masses that penetrate into the South and nor’easters on the East Coast, and the Madden-Julian Oscillation, which can impact the number of heavy rain storms in the Pacific Northwest.
The 2015 U.S. Winter Outlook (December through February):
Precipitation Outlook:
- Wetter-than-average conditions most likely in the Southern Tier of the United States, from central and southern California, across Texas, to Florida, and up the East Coast to southern New England. Above-average precipitation is also favored in southeastern Alaska.
- Drier-than-average conditions most likely for Hawaii, central and western Alaska, parts of the Pacific Northwest and northern Rockies, and for areas near the Great Lakes and Ohio Valley.
Temperature Outlook:
- Above-average temperatures are favored across much of the West and the northern half of the contiguous United States. Temperatures are also favored to be above-average in Alaska and much of Hawaii. Below-average temperatures are most likely in the southern Plains and Southeast.
Drought Outlook:
- The U.S. Drought Outlook shows some improvement is likely in central and southern California by the end of January, but not drought removal. Additional statewide relief is possible during February and March. Drought removal is likely across large parts of the Southwest, while improvement or removal is also likely in the southern Plains. However, drought is likely to persist in the Pacific Northwest and northern Rockies, with drought development likely in Hawaii, parts of the northern Plains and in the northern Great Lakes region.
While it is good news that drought improvement is predicted for California, one season of above-average rain and snow is unlikely to remove four years of drought,” said Halpert. “California would need close to twice its normal rainfall to get out of drought and that’s unlikely.”
This seasonal outlook does not project where and when snowstorms may hit or provide total seasonal snowfall accumulations. Snow forecasts are dependent upon the strength and track of winter storms, which are generally not predictable more than a week in advance.
NOAA produces seasonal outlooks to help communities prepare for what’s likely to come in the next few months and minimize weather’s impacts on lives and livelihoods. Empowering people with actionable forecasts and winter weather tips is key to NOAA’s effort to build a Weather-Ready Nation.
NOAA’s mission is to understand and predict changes in the Earth’s environment, from the depths of the ocean to the surface of the sun, and to conserve and manage our coastal and marine resources. Join us on Facebook, Twitter, Instagram and our other social media channels.
Denver breaks record high temperature for October 11
 Temperatures this weekend were more akin to what we expect in August than what we normally see in the second week of October. That bears out with the fact we broke the all-time record high temperature for today’s date.
At 1:46pm the temperature at Denver International Airport, Denver’s official station, topped out at 87 degrees. This easily bests the previous record high for October 11 of 85 degrees recorded in 1996 and 1975.
Here in Thornton, we matched the 87 degree reading at 2:28pm.
The extended forecast does provide for cooler temperatures for the rest of the week, however they will continue to be a good bit above average for this time of year. Get the extended forecast here.
Thornton’s October preview: Fall should finally make an appearance
 With the first full month of fall here, October usually brings one of the quietest weather months in the Denver area with plenty of mild, sunny days and clear, cool nights.
October is historically the second sunniest month and conditions are generally calm.
However we also will usually see our first taste of winter during the month with the first freeze and first snowfall of the season. Temperatures as well will start to drop and by the end of the month the average nighttime lows are below freezing.
For complete details on our historical October weather and what we can expect in the coming month, read our complete October weather preview here.
September 2015 weather recap: One of the warmest, driest on record
With the mercury stuck stubbornly at the top of the scale and barely a few raindrops falling into the bucket, September 2015 will be going into the books as one of the warmest and driest on record.
High pressure dominated the entire region during the month. This allowed temperatures to consistently climb above normal and helped prevent moisture from arriving in any significant amounts. At Denver International Airport, 27 of the 30 days had above normal temperatures. Thornton’s overall temperatures were cooler than DIA’s but we were still quite a bit warmer than average.
The monthly average temperature in Thornton came in at 67.1 degrees. Out at the airport where the Mile High City’s official measurements are taken, the average was 69.4 degrees.
Denver’s historical average for September is 63.4 so both locations came in well above normal. Officially, September 2015 ranks as the warmest September on record, easily jumping to the number one spot over September 1948 which had an average of 68.3 degrees.
Undoubtedly the big difference between measurements at DIA and other locations in the metro area are yet another example of the airport’s readings consistently being an outlier from the reality seen in more populated areas. This has been an ongoing problem since the National Weather Service moved the official station from Stapleton.
The warmest mercury reading in Thornton during the month was 94 degrees on the 13th. The coldest came on the 19th when temperatures dipped to 40 degrees in the early morning hours. Eight days in Thornton topped out above the 90 degree mark.
At the airport, Denver’s warmest reading of 92 degrees came on September 2. It’s coldest on September 19 (44 degrees). The airport saw seven days with above 90 degree maximums.
Just as the month was exceedingly warm, it also was very dry. Thornton saw a mere 0.09 inches fall in its rain bucket and Denver recorded 0.11 inches. Both were far short of the September precipitation average of 0.96 inches.
DIA’s measurement means September 2015 goes into the books with the 9th least amount of precipitation in September since 1872 (16th driest overall).
Click here to view Thornton’s September 2015 climate report.


From the National Weather Service:
CLIMATE REPORT
NATIONAL WEATHER SERVICE BOULDER, CO
244 AM MDT THU OCT 1 2015

...THE DENVER CO CLIMATE SUMMARY FOR THE MONTH OF SEPTEMBER 2015...

CLIMATE NORMAL PERIOD 1981 TO 2010
CLIMATE RECORD PERIOD 1872 TO 2015

WEATHER         OBSERVED          NORMAL  DEPART  LAST YEAR`S
                 VALUE   DATE(S)  VALUE   FROM    VALUE  DATE(S)
                                          NORMAL
................................................................
TEMPERATURE (F)
RECORD
 HIGH              97   09/06/2013
                        09/05/2013
                        09/04/1995
 LOW               17   09/29/1985
HIGHEST            92   09/02        91       1       94  09/03
LOWEST             44   09/19        35       9       33  09/12
AVG. MAXIMUM     85.2              78.5     6.7     78.9
AVG. MINIMUM     53.5              48.3     5.2     50.6
MEAN             69.4              63.4     6.0     64.8
DAYS MAX >= 90      7               3.4     3.6        2
DAYS MAX <= 32      0               0.0     0.0        0
DAYS MIN <= 32      0               0.8    -0.8        0
DAYS MIN <= 0 0 0.0 0.0 0

PRECIPITATION (INCHES)
RECORD
 MAXIMUM 5.61 2013
 MINIMUM T 1892 1944
TOTALS 0.11 0.96 -0.85 1.79
DAILY AVG. 0.00 0.03 -0.03 0.06
DAYS >= .01         3               6.5    -3.5        9
DAYS >= .10         0               3.3    -3.3        4
DAYS >= .50         0               0.6    -0.6        1
DAYS >= 1.00        0               0.1    -0.1        1
GREATEST
 24 HR. TOTAL    0.12   08/31 TO 09/01           09/29 TO 09/29
                                                          09/28 TO 09/29
                                                          09/29 TO 09/29
 STORM TOTAL       MM                                 MM
 (MM/DD(HH))            MM                    09/29(00) TO 09/29(00)
                                                 09/29(00) TO 09/29(00)9
                                                 09/29(00) TO 09/29(00)9

SNOWFALL (INCHES)
RECORDS
 TOTAL             MM   MM
TOTALS            0.0               1.3

DEGREE_DAYS
HEATING TOTAL       9               125    -116       91
 SINCE 7/1         27               141    -114       98
COOLING TOTAL     148                76      72       88
 SINCE 1/1        861               764      97      701

FREEZE DATES
RECORD
 EARLIEST     09/08/1962
 LATEST       06/08/2007
EARLIEST                        10/07
LATEST                          05/05
..........................................................

WIND (MPH)
AVERAGE WIND SPEED              9.0
RESULTANT WIND SPEED/DIRECTION   2/195
HIGHEST WIND SPEED/DIRECTION    35/280    DATE  09/07
HIGHEST GUST SPEED/DIRECTION    54/270    DATE  09/07

SKY COVER
POSSIBLE SUNSHINE (PERCENT)   MM
AVERAGE SKY COVER           0.40
NUMBER OF DAYS FAIR           12
NUMBER OF DAYS PC             17
NUMBER OF DAYS CLOUDY          1

AVERAGE RH (PERCENT)     41

WEATHER CONDITIONS. NUMBER OF DAYS WITH
THUNDERSTORM              6     MIXED PRECIP               0
HEAVY RAIN                0     RAIN                       3
LIGHT RAIN                7     FREEZING RAIN              0
LT FREEZING RAIN          0     HAIL                       3
HEAVY SNOW                0     SNOW                       0
LIGHT SNOW                0     SLEET                      0
FOG                       3     FOG W/VIS <= 1/4 MILE      5
HAZE                      1

-  INDICATES NEGATIVE NUMBERS.
R  INDICATES RECORD WAS SET OR TIED.
MM INDICATES DATA IS MISSING.
T  INDICATES TRACE AMOUNT.