All posts by Thornton Weather

ThorntonWeather.com is your local source for live Thornton, Colorado weather conditions and news!

July 2013 State of the Climate: U.S. warmer, wetter than average

Significant Climate Events - July 2013 (NOAA)
Significant Climate Events – July 2013 (NOAA). Click for larger view.

The National Oceanic and Atmospheric Administration (NOAA) released its July 2013 State of the Climate report saying that while the average U.S. temperature was warmer than normal, precipitation was higher than normal.

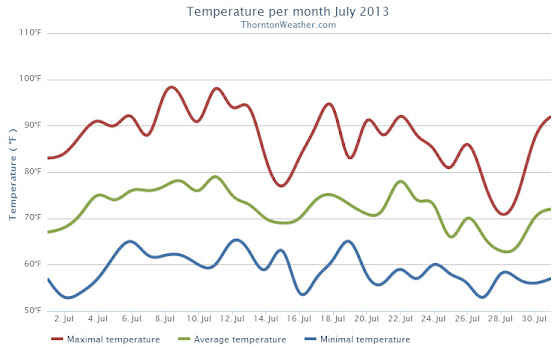
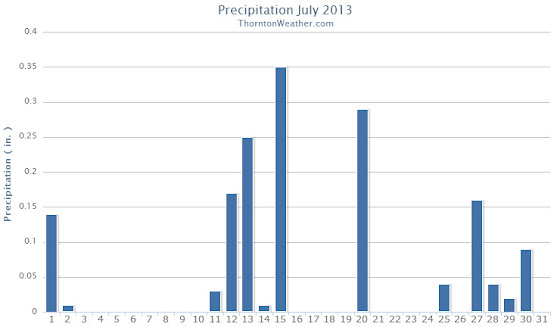
As we reported earlier, here in the Denver area temperatures were largely average during the month.  Precipitation was close to normal but fell short of that mark.

The SOTC’s larger view shows the contiguous United States’ average temperature was 0.8° above the 20th century average.  This ranks it as the 30th warmest July on record.

In terms of precipitation, the nation enjoyed a wetter than average month, one that ranks it as the 5th wettest July since record-keeping began.

Below are the climate highlights from NOAA for July 2013.  Click here to view the full, comprehensive report.

From NOAA:

Climate Highlights — July

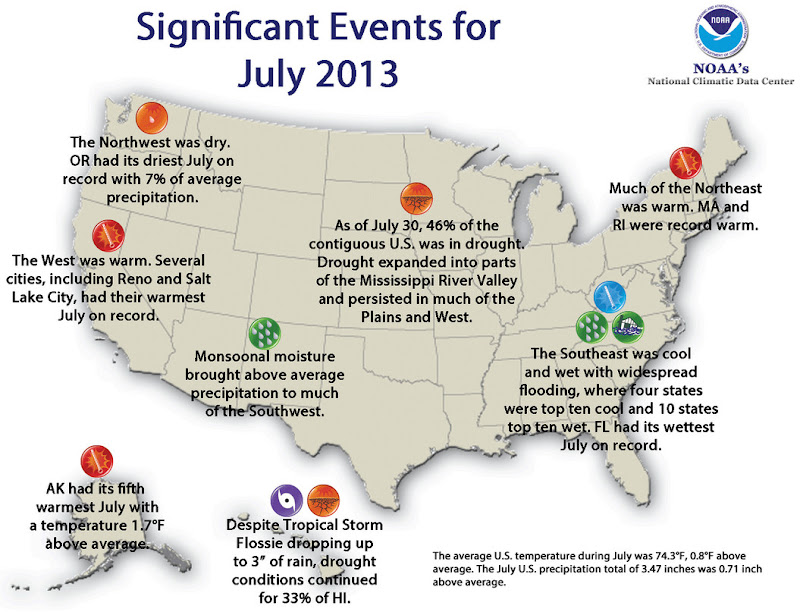
  • The average temperature for the contiguous U.S. during July was 74.3°F, 0.8°F above the 20th century average, and ranked as the 30th warmest such month on record.
  • The western U.S. was warmer than average, where IdahoNevadaOregon, and Utah each had a top ten warm month. Several cities, including Salt Lake City, Utah, and Reno, Nev., had their warmest July on record.Seven states across the Northeast also had July temperatures ranking among the ten warmest on record, including Massachusetts and Rhode Island, each of which had a record warm July.
  • Locations from the Central and Southern Plains into the Southeast were cooler than average. Four states —AlabamaArkansasMississippi, and Tennessee — had July temperatures that were among the ten coolest on record.
  • The Alaska statewide average temperature was 1.7°F above the 1971-2000 average and ranked as the fifth warmest July on record for the state. Anchorage had its fourth warmest July, and the city set a record with 14 consecutive days above 70°F.
  • The nationally-averaged July precipitation total of 3.47 inches was 0.71 inch above average and was the 5thwettest July on record for the contiguous United States.
  • Wetter-than-average conditions stretched from California, through the Southwest and Plains, and along the Eastern Seaboard. In the Southwest, seasonal monsoonal flow brought above average precipitation to several states, where Arizona and California both had July precipitation totals ranking among their ten wettest. During this time of year in parts of the Southwest, even light precipitation can result in above-average monthly totals but have minimal impacts on alleviating drought conditions.
  • In the East13 states had one of their ten wettest Julys on record, with the highest precipitation totals across the Southeast. Florida had its wettest July on record, with 12.38 inches of rainfall, 4.91 inches above average. The above-average precipitation in the Southeast resulted in widespread flooding and significant damage to crops.
  • The Northwest was particularly dry. Oregon had its driest July on record with only 0.03 inch of rainfall accumulating, 0.41 inch below average. Washington had its eighth driest July. Below-average precipitationwas also observed in the Upper Mississippi River Valley, where Iowa had its tenth driest July.
  • According to the July 30 U.S. Drought Monitor report, 45.6 percent of the contiguous U.S experienced drought conditions, up slightly from the beginning of July. Drought remained entrenched throughout much of the West and in parts of the Central and Southern Plains, and drought expanded into parts of the Lower Mississippi River Valley and Midwest. Over 20 percent of Alaska was in drought at the end of July, with severe drought developing in central parts of the state.
  • Based on NOAA’s Residential Energy Demand Temperature Index (REDTI), the contiguous U.S. temperature-related energy demand during July was above average and ranked as the 41st highest July value in the 119-year period of record.
  • The components of the U.S. Climate Extremes Index (USCEI) that examine extremes in warm night time temperatures, the spatial extent of wetness and drought, and extremes in days with rainfall were all above average. When combined with the other components of the index, the USCEI, as a whole, was only slightly above average. The USCEI is an index that tracks the highest and lowest 10 percent of extremes in temperature, precipitation, tropical cyclones, and drought across the contiguous United States.
  • On a local basis, the number of record warm daily highs and lows (2560) during July was roughly the same as the number of record cool daily highs and lows (2846), although there were slightly more cool records.
  • Climate Highlights — year-to-date (January – July)
  • The year-to-date contiguous U.S. temperature of 51.8°F was 0.5°F above the 20th century average and tied with 1952 as the 42nd warmest January–July on record. Above-average temperatures were observed in the West and Northeast, where CaliforniaNew Hampshire, and Vermont had one of their top ten warmest year-to-date periods. Below-average temperatures stretched from the Northern Plains to the Southeast.
  • The year-to-date contiguous U.S. precipitation total of 19.14 inches was 1.54 inches above average and tied with 1997 as the 22nd wettest January–July on record. However, rainfall was not evenly distributed across the country. Dry precipitation extremes were observed in the West and wet precipitation extremes were observed in the East.
  • CaliforniaIdahoNevada, and Oregon each had a top ten dry year-to-date period. California’s precipitation total of 4.58 inches was record low for the seven-month period at 9.82 inches below average, and 1.69 inches less than the previous record dry January–July of 1898.
  • Above-average precipitation was observed across most locations east of the Rockies, with ten states having one of their ten wettest year-to-date periods. Michigan was record wet with 24.35 inches of precipitation, 6.92 inches above average, and 2.30 inches above the previous record wet January–July of 1950. Several cities, from Fargo, North Dakota to Greenville, South Carolina, had a record wet January–July.
  • Based on NOAA’s Residential Energy Demand Temperature Index (REDTI), the contiguous U.S. temperature-related energy demand during January–July was below average and ranked as the 47th lowest January–July value in the 119-year period of record.
  • The components of the USCEI that examine extremes in the spatial extent of drought, as well as 1-day precipitation totals and days with rainfall were much above average for the year-to-date. When combined with the other components of the index, the USCEI, as a whole, was only slightly above average.

Regional Highlights for the Colorado area

High Plains Region: (Information provided by the High Plains Regional Climate Center)

  • Average temperatures were generally below normal in the east and above normal in the west across the High Plains Region this month. Temperature departures of 2.0-4.0 degrees F (1.1-2.2 degrees C) below normal occurred in eastern Kansas, central South Dakota, western North Dakota, and a few pockets of Nebraska. Meanwhile, western portions of Colorado and Wyoming had temperature departures of 3.0-5.0 degrees F (1.7-2.8 degrees C) above normal. The cooler temperatures in the east were in stark contrast to last year, when a good portion of the area had temperature departures of 6.0-8.0 degrees F (3.3-4.4 degrees C) above normal. Although monthly records were not set, a few stations did manage to sneak in to the top 10 rankings for warmest or coolest July. On the cool side, long-term station Wamego 4 W, which is located in northeastern Kansas, had its 5th coolest July with an average temperature of 75.6 degrees F (24.2 degrees C). The coolest July at Wamego 4 W was 72.0 degrees F (22.2 degrees C) in 1950 (period of record 1912-2013). On the warm side, Lander, Wyoming had its 10th warmest July with 74.2 degrees F (23.4 degrees C). Interestingly, 7 of the top 10 warmest Julys have occurred since 2000 in Lander and the top spot of 75.9 degrees F (24.4 degrees C) occurred in both 2003 and 2006 (period of record 1891-2013). While monthly extremes were not common, numerous daily records occurred throughout the month. One notable record was for the July all-time coolest maximum temperature in Concordia, Kansas. On July 28th, Concordia’s high temperature only reached 62.0 degrees F (16.7 degrees C) and beat out the old record of 63.0 degrees F (17.2 degrees C) which occurred back in 1979 and 1988 (period of record 1885-2013).
  • July precipitation was hit or miss across the High Plains Region. Areas receiving at least 150 percent of normal precipitation included central Kansas, central South Dakota, central and western Colorado, and scattered pockets in eastern Wyoming, north central Nebraska, southwestern South Dakota, and northern North Dakota. While rain was needed to help alleviate ongoing drought conditions, some storms brought heavy rain which caused mudslides in fire burn scars in Colorado and flash flooding in parts of Colorado, Kansas, and Wyoming. Areas which missed out included eastern and central Nebraska, eastern and central North Dakota, and central Wyoming. These areas received less than 50 percent of normal precipitation. Because of the wide range in precipitation, there were stations which ranked in the top 10 driest or wettest Julys on record. With only 11 percent of normal precipitation, Omaha, Nebraska had its 2nd driest July on record with 0.44 inches (11 mm) of precipitation (period of record 1871-2013). The driest on record occurred only last year with 0.01 inches (0 mm). Meanwhile, precipitation in central Kansas helped alleviate drought conditions there, although long-term deficits were still high. For instance, Wichita, Kansas had measurable precipitation on 17 days in July, which broke the old record of 16 in 1950 (period of record 1888-2013). On average, Wichita has about 8 days with measurable precipitation in July. By the end of the month, Wichita received 7.69 inches (195 mm) of precipitation making this July its 4th wettest. Although 232 percent of normal, this was not nearly enough to beat the top spot of 13.37 inches (340 mm) in 1950.
  • The latest U.S. Drought Monitor showed both improvements and degradations over the past month. At the end of July, approximately 64 percent of the Region was in moderate (D1) to exceptional (D4) drought – down just slightly from 67 percent at the end of June. An expansion of abnormally dry conditions (D0) occurred in east-central North Dakota and eastern parts of Kansas, Nebraska, and South Dakota. In addition, two new areas of D1 were introduced in far southeastern South Dakota and northeastern Kansas. One category improvements were made in some areas of north-central and eastern Colorado. There was quite a bit of jostling of drought conditions in Kansas where some areas had improvements, while others had degradations. By the end of the month, 25 percent of the state remained in the D4 designation, however. Wyoming had an increase in severe (D2) and extreme (D3) drought coverage, going from about 47 percent of the state to 52 percent of the state. According to the U.S. Seasonal Drought Outlook released July 18th, the only area of drought expected to improve was in southwestern Colorado. Drought conditions were expected to develop in north-central Colorado and persist elsewhere through October 2013.
  • For more information, please go to the High Plains Regional Climate Center Home Page.

July 2013 weather recap: Mostly normal conditions prevail

Following two hot and dry months in May and June, July brought some relief in the form of near normal temperatures and precipitation.

Cooler than normal temperatures started the month during the first couple of days of July.  That changed for the following 10 days when temperatures bounced to above normal levels with Thornton recording eight 90+ degree days during the period.

The next few days from the 14th to the 16th brought much cooler conditions and much-needed precipitation.  Seasonal temperatures then settled in through the 23rd.  As the month came to a close, temperatures became more moderate and we even saw three days (the 27th, 28th, and 29th) with highs in the 70s.  Most notably we once again saw some precipitation.

Thornton saw an average temperature during July of 72.1 degrees.  This was a good bit below the long term Denver historical average of 74.3 degrees.  Officially at DIA the average temperature for the month was 74.2 degrees.

We recorded 14 days with temperatures at or equal to 90 degrees.  Temperatures ranged from a high of 98.5 degrees on the 11th down to a low of 52.6 degrees on the 27th.

A reasonable 1.61 inches of precipitation fell into Thornton’s rain bucket during the month.  This was a bit below the average for July of 2.16 inches.  Out at the airport, Denver fared a bit better with 1.98 inches.

Click here to view Thornton’s July 2013 climate summary.

Thornton, Colorado July 2013 Temperatures.
Thornton, Colorado July 2013 Precipitation.
CLIMATE REPORT
NATIONAL WEATHER SERVICE BOULDER, CO
210 AM MDT THU AUG 1 2013

...THE DENVER CO CLIMATE SUMMARY FOR THE MONTH OF JULY 2013... 

CLIMATE NORMAL PERIOD 1981 TO 2010
CLIMATE RECORD PERIOD 1872 TO 2013

WEATHER         OBSERVED          NORMAL  DEPART  LAST YEAR`S
                 VALUE   DATE(S)  VALUE   FROM    VALUE  DATE(S)
                                          NORMAL
................................................................ 
TEMPERATURE (F)
RECORD
 HIGH             105   07/20/2005
 LOW               42   07/04/1903
                        07/31/1873
HIGHEST           100   07/11       105      -5      102  07/21
LOWEST             55   07/02        42      13       57  07/26
AVG. MAXIMUM     88.2              89.4    -1.2     94.4
AVG. MINIMUM     60.4              58.9     1.5     63.4
MEAN             74.3              74.2     0.1     78.9
DAYS MAX >= 90     17              16.0     1.0       27
DAYS MAX <= 32      0               0.0     0.0        0
DAYS MIN <= 32      0               0.0     0.0        0
DAYS MIN <= 0       0               0.0     0.0        0

PRECIPITATION (INCHES)
RECORD
 MAXIMUM         6.41   1965
 MINIMUM         0.01   1901
TOTALS           1.98              2.16   -0.18     0.48
DAILY AVG.       0.06              0.07   -0.01     0.02
DAYS >= .01         7               8.3    -1.3        6
DAYS >= .10         4               4.3    -0.3        2
DAYS >= .50         2               1.4     0.6        0
DAYS >= 1.00        0               0.7    -0.7        0
GREATEST
 24 HR. TOTAL    0.87   07/15 TO 07/15           07/06 TO 07/07
                        07/14 TO 07/15                    07/31 TO 07/31
                        07/15 TO 07/15                    07/31 TO 07/31
 STORM TOTAL       MM                                 MM
 (MM/DD(HH))            MM                    07/07(00) TO 07/07(00)
                                                 07/31(00) TO 07/31(00)1
                                                 07/31(00) TO 07/31(00)1

SNOWFALL (INCHES)
RECORDS
 TOTAL             MM   MM
TOTALS            0.0               0.0

DEGREE_DAYS
HEATING TOTAL       0                 6      -6        0
 SINCE 7/1          0                 6      -6        0
COOLING TOTAL     295               289       6      438
 SINCE 1/1        558               444     114      803

FREEZE DATES
RECORD
 EARLIEST     09/08/1962
 LATEST       06/08/2007
EARLIEST                        10/07
LATEST                          05/05
.................................................. 

WIND (MPH)
AVERAGE WIND SPEED              10.3
RESULTANT WIND SPEED/DIRECTION   3/163
HIGHEST WIND SPEED/DIRECTION    45/050    DATE  07/20
HIGHEST GUST SPEED/DIRECTION    58/040    DATE  07/20

SKY COVER
POSSIBLE SUNSHINE (PERCENT)   MM
AVERAGE SKY COVER           0.60
NUMBER OF DAYS FAIR            5
NUMBER OF DAYS PC             24
NUMBER OF DAYS CLOUDY          2

AVERAGE RH (PERCENT)     50

WEATHER CONDITIONS. NUMBER OF DAYS WITH
THUNDERSTORM              0     MIXED PRECIP               0
HEAVY RAIN                2     RAIN                       3
LIGHT RAIN               13     FREEZING RAIN              0
LT FREEZING RAIN          0     HAIL                       0
HEAVY SNOW                0     SNOW                       0
LIGHT SNOW                0     SLEET                      0
FOG                       6     FOG W/VIS <= 1/4 MILE      1
HAZE                     13

-  INDICATES NEGATIVE NUMBERS.
R  INDICATES RECORD WAS SET OR TIED.
MM INDICATES DATA IS MISSING.
T  INDICATES TRACE AMOUNT.

NASA’s Cassini sends back images of Earth from 900 million miles away

In this rare image taken on July 19, 2013, the wide-angle camera on NASA's Cassini spacecraft has captured Saturn's rings and our planet Earth and its moon in the same frame. (NASA/JPL-Caltech/Space Science Institute)
In this rare image taken on July 19, 2013, the wide-angle camera on NASA’s Cassini spacecraft has captured Saturn’s rings and our planet Earth and its moon in the same frame. Scroll down for a larger image or click to view the full size image. (NASA/JPL-Caltech/Space Science Institute)

Launched in 1997, NASA’s Cassini space probe arrived in Saturn orbit in 2004 and has provided valuable insight into the sixth planet in our solar system as well as others.  On July 19 of this year the spacecraft took an extraordinary image of our home planet and moon as seen from nearly 900 miles away.

The image captured the planet around which Cassini is orbiting, its infamous rings and off in the distance, the planet Earth and our moon.  The pale blue hue of our planet is almost unmistakable among the features in the photo.  It truly does make one feel small when compared to the immensity of the heavens above.

NASA’s press release says in part:

“In the Cassini images Earth and the moon appear as mere dots — Earth a pale blue and the moon a stark white, visible between Saturn’s rings. It was the first time Cassini’s highest-resolution camera captured Earth and its moon as two distinct objects.

“It also marked the first time people on Earth had advance notice their planet’s portrait was being taken from interplanetary distances. NASA invited the public to celebrate by finding Saturn in their part of the sky, waving at the ringed planet and sharing pictures over the Internet. More than 20,000 people around the world participated.

“”We can’t see individual continents or people in this portrait of Earth, but this pale blue dot is a succinct summary of who we were on July 19,” said Linda Spilker, Cassini project scientist, at NASA’s Jet Propulsion Laboratory in Pasadena, Calif. “Cassini’s picture reminds us how tiny our home planet is in the vastness of space, and also testifies to the ingenuity of the citizens of this tiny planet to send a robotic spacecraft so far away from home to study Saturn and take a look-back photo of Earth.”

“Pictures of Earth from the outer solar system are rare because from that distance, Earth appears very close to our sun. A camera’s sensitive detectors can be damaged by looking directly at the sun, just as a human being can damage his or her retina by doing the same. Cassini was able to take this image because the sun had temporarily moved behind Saturn from the spacecraft’s point of view and most of the light was blocked.”

In this rare image taken on July 19, 2013, the wide-angle camera on NASA's Cassini spacecraft has captured Saturn's rings and our planet Earth and its moon in the same frame. Click to view the full size image.  (NASA/JPL-Caltech/Space Science Institute)
In this rare image taken on July 19, 2013, the wide-angle camera on NASA’s Cassini spacecraft has captured Saturn’s rings and our planet Earth and its moon in the same frame. Click to view the full size image. (NASA/JPL-Caltech/Space Science Institute)

City of Thornton adds live online feed of Channel 8 community access TV

Thornton 8 is now available for live, online streaming on the city's website and ThorntonWeather.com.
Thornton 8 is now available for live, online streaming on the city’s website and ThorntonWeather.com. (City of Thornton)

The City of Thornton’s KTTV-8 television channel can be a great resource for information as to what is going on in our fine city.  Unfortunately watching the channel required you subscribed to Comcast cable – until now.

We were browsing the city’s website today and noticed they have added a live Internet feed of the channel.  This is a great development and one that allows all Thornton residents with Internet access to view the station and get the latest city news and information.

You can watch it directly on the city’s website here.

Alternatively, we have added a page on our website where you can watch the live feed.  You will find it under the ‘Area Information’ button to the left or click here to view it.

Please note: ThorntonWeather.com is not endorsed by or an official website of the City of Thornton.


Late day thunderstorms bring much-needed rain, stunning visuals afterwards

After dumping more than a quarter inch of rain in 20 minutes on Thornton, the storm moved to the southeast and intensified. View the slideshow below for more imagery from the event.  (ThorntonWeather.com)
A view of the thunderstorm on Saturday, July 20, 2013 after it passed Thornton. View more imagery in the slideshow below. (ThorntonWeather.com)

The forecast called for a chance for thunderstorms and Mother Nature obliged on Saturday.  Heavy rain and gusty winds struck the north metro area but what followed was perhaps more interesting.

In all, Thornton recorded 0.29” of rain in a very short period from 4:30 to 4:55pm.  Some small hail accompanied the storm as did strong wind gusts.  There were some reports of broken tree limbs from the powerful gusts.

After the storm moved to the southeast, it continued to intensify.  From almost any vantage point in Thornton, the scene was amazing.

Initially the bright while tops of the storm cells were stark and beautiful to watch.  A nearly full moon then began to rise in the east behind the storms and the scene was stunning.  As the sun went down, the clouds turned a shade of amber providing a colorful scene with the rising moon.

The slideshow below has a nice little compilation of image taken by ThorntonWeather.com and some of our fans on Facebook.

Mid-summer snow dusts Loveland Ski Area

July 18, 2013 - Loveland Ski Area received a dusting of snow.  While a bit unusual in mid-summer, certainly not unheard of given an altitude at the base of 10,800 feet. (Loveland Ski Area)
July 18, 2013 – Loveland Ski Area received a dusting of snow. While a bit unusual in mid-summer, certainly not unheard of given an altitude at the base of 10,800 feet. (Loveland Ski Area)

At an altitude of 10,800 feet, Loveland Ski Area is certainly in some rarified air.  Yesterday the resort saw a dusting of snow while Colorado residents below in the Mile High City simmered in 90+ degree temperatures.

Snowfall can occur in Colorado’s high country any time of year, even in mid-summer, and yesterday’s event was not particularly unusual.

Here in Denver however there has never officially been snow in July.  The key word though is ‘officially.’

Unofficially there has been snow in the Mile High City in July – almost exactly one year ago today in fact.

Check out this tidbit from the National Weather Service archives:

“On July 17, 1872…the U.S. Army Signal Service weather observer recorded snowfall during the early morning hours in the hand written daily weather journal: “rain commenced at 1:30 a.m. changing about 3 a.m. to snow & in about half an hour to rain again; it continued until 6 a.m.” This is the only recorded occurrence of snowfall in Denver in July…but this report is not included in the “official” station snowfall records…which did not begin in Denver until January 1…1882. The low temperature on this morning was 45 degrees…which is sufficiently cold for the occurrence of light stratiform snowfall.”

Stunning image captures lightning strike from wildfire’s pyrocumulus cloud

Weather of course clearly affects wildfires but fires themselves can literally create their own weather.  One such phenomena are pyrocumulus clouds and a photo from a wildfire in Alaska provides a stunning example.

Pyrocumulus clouds are formed by fires or volcanos when the intense heat from the event rises from the surface.  These clouds oftentimes look like dirty thunderstorm clouds directly over a blaze and can give rise to thunderstorm-like weather conditions.

Lightning from these clouds can occur and in particular when coupled with a volcanic eruption are absolutely amazing.  With wildfires, the strong winds and lightning can result in dangerous and unpredictable expansion of a fire.

The Moon Lake Complex Fire is currently burning in eastern Alaska and has scorched over 18,000 acres.  Inciweb posted a photo of a pyrocumulus cloud over the blaze near Tok that let loose a stunning bolt of lightning.

June 2, 2013 - A pyrocumulus cloud above the Moon Lake Complex Fire in Alaska unleashes a lightning bolt. (Inciweb)
June 2, 2013 – A pyrocumulus cloud above the Moon Lake Complex Fire in Alaska unleashes a lightning bolt. (Inciweb)

June 2013 weather recap: Hot and dry conditions dominate

In writing the history of the weather for the area for June 2013 two words come to mind: hot and dry.  While both conditions were certainly prevalent, we can at least be consoled by the fact that it could have been worse.

The month actually started cooler than normal with six of the first seven days recording below average temperatures.  Soon though high pressure built over the area and temperatures began to climb with many days for the balance seeing above normal mercury readings.

Thunderstorms did occur during the month but not with any particularly notable frequency or ferocity.  Most notable though was a tornado that struck near Denver International Airport on the 18th of the month.  The twister was responsible for Denver’s peak wind gust of the month of 97 mph.

June 2013 wrapped up with an average temperature in Thornton of 70.5 degrees.  This was well above Denver’s historical average for the month of 67.4 degrees.  Officially Denver’s average temperature last month was 71.1 degrees, warm enough to put it in a tie for the 10th warmest June in Denver history.

In all, Thornton recorded 10 days with mercury readings above 90 degrees.  Denver saw 14.

The warmest temperature of the month in Thornton was 99.2 degrees on the 11th.  That same day Denver hit 100 degrees, its high reading of the month.

Thornton’s coldest temperature came on the 6th when the temperature dropped to 41.6 degrees.  Denver’s officially bested that with a low temperature for the month of 39 degrees on the 2nd.

Denver officially broke three temperature records during the month:

In terms of precipitation the month was certainly dry but not the worst we have seen.  Thornton recorded a scant 0.49 inch in the rain bucket.  Denver bested us slightly by recording 0.75 inches.  Both measurements were far below the 1.98 inch historical average for June but certainly better than the driest June on record in 1890 when only a trace was recorded.

Click here to view Thornton’s June 2013 climate summary.

Thornton, Colorado June 2013 Temperatures.
Thornton, Colorado June 2013 Precipitation.
CLIMATE REPORT
NATIONAL WEATHER SERVICE BOULDER, CO
210 AM MDT MON JUL 1 2013

................................... 

...THE DENVER CO CLIMATE SUMMARY FOR THE MONTH OF JUNE 2013... 

CLIMATE NORMAL PERIOD 1981 TO 2010
CLIMATE RECORD PERIOD 1872 TO 2013

WEATHER         OBSERVED          NORMAL  DEPART  LAST YEAR`S
                 VALUE   DATE(S)  VALUE   FROM    VALUE  DATE(S)
                                          NORMAL
................................................................ 
TEMPERATURE (F)
RECORD
 HIGH             105   06/26/2012
                        06/25/2012
                        54/01/2206
 LOW               30   06/02/1951
HIGHEST           100   06/11       104      -4      105  06/26
                                                          06/25
LOWEST             39   06/02        30       9       43  06/11
AVG. MAXIMUM     87.8              82.4     5.4     91.7
AVG. MINIMUM     54.3              52.3     2.0     58.4
MEAN             71.1              67.4     3.7     75.0
DAYS MAX >= 90     14               7.9     6.1       17
DAYS MAX <= 32      0               0.0     0.0        0
DAYS MIN <= 32      0               0.0     0.0        0
DAYS MIN <= 0       0               0.0     0.0        0

PRECIPITATION (INCHES)
RECORD
 MAXIMUM         4.96   1882
 MINIMUM            T   1890
TOTALS           0.75              1.98   -1.23     1.22
DAILY AVG.       0.03              0.07   -0.04     0.04
DAYS >= .01         4               8.4    -4.4        2
DAYS >= .10         2               4.6    -2.6        2
DAYS >= .50         1               1.4    -0.4        2
DAYS >= 1.00        0               0.3    -0.3        0
GREATEST
 24 HR. TOTAL    0.51   06/23 TO 06/23           06/06 TO 06/07
                        06/22 TO 06/23                    06/23 TO 06/23
                        06/23 TO 06/23                    06/23 TO 06/23
 STORM TOTAL       MM                                 MM
 (MM/DD(HH))            MM                    06/07(00) TO 06/07(00)
                                                 06/23(00) TO 06/23(00)3
                                                 06/23(00) TO 06/23(00)3

SNOWFALL (INCHES)
RECORDS
 TOTAL             MM   MM
TOTALS            0.0               0.0

DEGREE_DAYS
HEATING TOTAL      29                62     -33        6
 SINCE 7/1       6084              6058      26     5399
COOLING TOTAL     221               133      88      314
 SINCE 1/1        263               155     108      365

FREEZE DATES
RECORD
 EARLIEST     09/08/1962
 LATEST       06/08/2007
EARLIEST      03/01             10/07
LATEST        04/24             05/05
.................................................... 

WIND (MPH)
AVERAGE WIND SPEED              10.7
RESULTANT WIND SPEED/DIRECTION   2/156
HIGHEST WIND SPEED/DIRECTION    64/060    DATE  06/18
HIGHEST GUST SPEED/DIRECTION    97/040    DATE  06/18

SKY COVER
POSSIBLE SUNSHINE (PERCENT)   MM
AVERAGE SKY COVER           0.50
NUMBER OF DAYS FAIR            6
NUMBER OF DAYS PC             23
NUMBER OF DAYS CLOUDY          1

AVERAGE RH (PERCENT)     42

WEATHER CONDITIONS. NUMBER OF DAYS WITH
THUNDERSTORM              0     MIXED PRECIP               0
HEAVY RAIN                3     RAIN                       2
LIGHT RAIN                7     FREEZING RAIN              0
LT FREEZING RAIN          0     HAIL                       0
HEAVY SNOW                0     SNOW                       0
LIGHT SNOW                0     SLEET                      0
FOG                       4     FOG W/VIS <= 1/4 MILE      0
HAZE                      6

-  INDICATES NEGATIVE NUMBERS.
R  INDICATES RECORD WAS SET OR TIED.
MM INDICATES DATA IS MISSING.
T  INDICATES TRACE AMOUNT.

Reminder: Personal use of fireworks illegal in the City of Thornton, big time fines await violators

Fireworks
Fireworks are illegal in Thornton and with the tinder dry conditions this year, fire danger is extraordinarily high. Please leave the show to the pros!

Fireworks have long been illegal in the City of Thornton and in recent years stiff fines have been meted out to violators.  Like last year, conditions are tinder dry and as such it is especially important that residents adhere to the law and leave the show to the pros.

Wildfires are burning across Colorado right now with tens of thousands of acres charred and more than 500 homes destroyed.    These events highlight that even a small spark in the dry conditions we are experiencing could lead to disaster.

The danger is there, even in an urban environment, where foliage is very dry, lawns are parched and building materials are completely dried out.  While residents could still go to Wyoming or unincorporated areas of Adams County to purchase them, the risk is simply not worth the minimal reward.

Not too many of us have an extra $500 lying around and that is what it will cost anyone who shoots off fireworks in Thornton.  A second violation in 12 months nets you a $1,000 fine.  Of course violators will also have to deal with the disdain of neighbors who likely do not appreciate the noise, mess, smoke, hassle and danger you present to their property.

The City of Thornton will be holding its annual 4th of July celebration with its usual second-to-none fireworks show.  ThorntonWeather.com asks all Thornton residents, please, don’t put anyone at risk.

Rather than spend money on fireworks – and fines – do something good with your money.  Donate to Help Colorado Now,  an organization sponsored by the state of Colorado dedicated to helping relief organizations assisting communities hit by disaster.  Show your support for our fellow Coloradans and leave the show to the pros.

Click here to visit the Help Colorado Now website.

Adams County implements Level 3 fire restrictions

With the landscape tinder dry and conditions ripe for wildfires, Adams County has announced a burn ban in all unincorporated areas.  Effective immediately, absolutely no open burning is allowed.

According the Brighton Blade,

[Adams County Sheriff’s Sgt. Paul] Gregory said the fire ban did not apply to fires within liquid fuels or gas stoves, fireplaces inside buildings and charcoal or propane grill fires at private residences. Fires within permanent fire grates in developed campgrounds are OK. So is burning household trash within a fireproof container that won’t let flame or burning material escape from the bottom of the container. Gregory said the container has to be in the center of an area that is 10 feet in diameter “from which all flammable material has been removed.”

The ban only applies to unincorporated areas of the county so is not applicable to Thornton residents within city limits.  Click the image below for a look at the restrictions.  To date we have not seen any fire ban ordered by the City of Thornton.

Adams County Sheriff Burning Restrictions