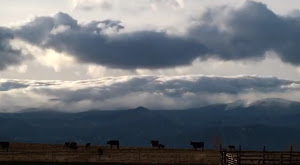
Screenshot of an amazing time lapse video showing mountain wave clouds. (YouTube / BasehuntersChasing)
Watching clouds in real time can be fascinating however it is when they are sped up via time lapse that we can oftentimes truly see the subtle motions that we otherwise miss. A time lapse video released by some local storm chasers provide a stunning visual of wave clouds near Boulder.
Posted to YouTube today by Basehunters Chasing, the video showcases scenes captured over a couple of days along the Front Range.
Rolling mountain wave clouds serve as a backdrop to cows in a field. Watching closely, snow can be seen falling on the highest mountain peaks. Zoomed in views of a wave cloud follow showing the amazing motion.
Lastly a sunset is seen with the clouds starting pastel orange, then turning brilliant bright orange before fading away.
The video is set to a very soothing flute-type instrumental. Check it out below.
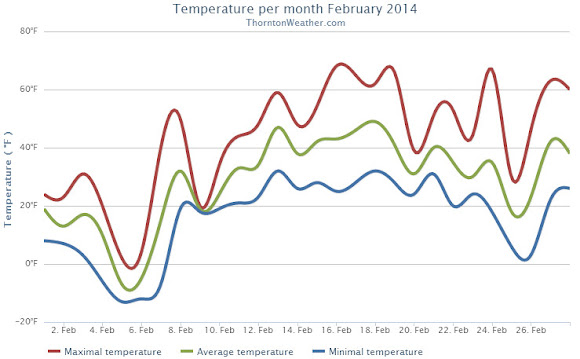
Like all months in Colorado, February 2014 did have some warm periods but those were few and far between as compared to the cold we experienced. Those cold temperatures did not translate to precipitation however.
The month started out quite cold with 9 out of the first 10 days seeing below normal temperatures. Two of those days saw ‘high’ temperatures only in the single digits. Seven of those 10 days stayed below freezing and four saw low temperatures below zero.
Warmer weather courtesy of downslope flow did finally arrive and most of the rest of the month was warmer than average. Of the last 18 days of the month, only two had below normal temperatures.
Overall Thornton’s monthly average temperature for February 2014 was 28.5 degrees. This was four degrees below Denver’s February average of 32.5 degrees. Officially Denver’s average for the month was close to ours at 28.2 degrees.
While clearly a cold month, February 2014 failed to reach ‘top 10 coldest February’ status. Number 10 on that list is February 1905 with an average temperature of 25.2 degrees. The coldest February was in 1899 with an average of 17.6 degrees.
Temperatures ranged from a high of 68.3 degrees on the 16th down to a low of -12.6 degrees on the morning of the 5th. Out at the airport, Denver saw its highest temperature of 68 degrees and its lowest of -19 degrees on the same dates.
Denver record low maximum temperatures on the 5th and 6th. High temperatures on those days were minus 1 degree and plus 1 degree respectively.
Thornton recorded a mere 0.17 inches of precipitation in the rain bucket during the month. Denver officially saw 0.19 inches. Both fall well short of the February average of 0.37 inches. While dry, it wasn’t dry enough to be one of the top 10 driest Februarys.
In terms of snowfall, Thornton measured 4.7 inches. Denver lagged with only 3.3 inches. Again, both were a good ways below the historical Denver average of 5.7 inches.
Thornton, Colorado February 2014 temperature summary. (ThorntonWeather.com)Add a Caption Thornton, Colorado February 2014 temperature summary. (ThorntonWeather.com)Thornton, Colorado February 2014 precipitation summary. (ThorntonWeather.com)
CLIMATE REPORT
NATIONAL WEATHER SERVICE BOULDER, CO
628 AM MST SAT MAR 1 2014

...................................

...THE DENVER CO CLIMATE SUMMARY FOR THE MONTH OF FEBRUARY 2014...

CLIMATE NORMAL PERIOD 1981 TO 2010
CLIMATE RECORD PERIOD 1872 TO 2014

WEATHER         OBSERVED          NORMAL  DEPART  LAST YEAR`S
                 VALUE   DATE(S)  VALUE   FROM    VALUE  DATE(S)
                                          NORMAL
................................................................
TEMPERATURE (F)
RECORD
 HIGH              77   02/28/2006
                        02/04/1890
 LOW              -25   02/01/1951
                        02/08/1936
HIGHEST            68   02/16        77      -9       63  02/17
LOWEST            -19   02/05       -25       6        5  02/22
AVG. MAXIMUM     42.3              46.2    -3.9     43.3
AVG. MINIMUM     14.1              18.9    -4.8     16.9
MEAN             28.2              32.5    -4.3     30.1
DAYS MAX >= 90      0               0.0     0.0        0
DAYS MAX <= 32      8               3.9     4.1        6
DAYS MIN <= 32     26              26.9    -0.9       28
DAYS MIN <= 0       5               1.3     3.7        0

PRECIPITATION (INCHES)
RECORD
 MAXIMUM         2.01   1934
 MINIMUM         0.01   1970
TOTALS           0.19              0.37   -0.18     0.77
DAILY AVG.       0.01              0.01    0.00     0.03
DAYS >= .01         4               5.3    -1.3        6
DAYS >= .10         1               0.7     0.3        4
DAYS >= .50         0               0.0     0.0        0
DAYS >= 1.00        0               0.0     0.0        0
GREATEST
 24 HR. TOTAL    0.12   02/04 TO 02/04              0.43
                                                 02/24 TO 02/24
 STORM TOTAL      2.3                                9.1
 (MM/DD(HH))            02/04 TO 02/04           02/24 TO 02/24

 SNOWFALL (INCHES)
RECORDS
 TOTAL           22.1   02-1912
 TOTAL            3.3   02-2014     5.7 1980-2010

DEGREE_DAYS
HEATING TOTAL    1022               908     114      972
 SINCE 7/1       4519              4439      80     4272
COOLING TOTAL       0                 0       0        0
 SINCE 1/1          0                 0       0        0

FREEZE DATES
RECORD
 EARLIEST     09/08/1962
 LATEST       06/08/2007
EARLIEST                        10/07
LATEST                          05/05
.....................................................

WIND (MPH)
AVERAGE WIND SPEED              10.5
RESULTANT WIND SPEED/DIRECTION   2/270
HIGHEST WIND SPEED/DIRECTION    48/270    DATE  02/16
HIGHEST GUST SPEED/DIRECTION    59/270    DATE  02/16

SKY COVER
POSSIBLE SUNSHINE (PERCENT)   MM
AVERAGE SKY COVER           0.60
NUMBER OF DAYS FAIR            2
NUMBER OF DAYS PC             18
NUMBER OF DAYS CLOUDY          8

AVERAGE RH (PERCENT)     63

WEATHER CONDITIONS. NUMBER OF DAYS WITH
THUNDERSTORM              0     MIXED PRECIP               0
HEAVY RAIN                0     RAIN                       0
LIGHT RAIN                1     FREEZING RAIN              0
LT FREEZING RAIN          0     HAIL                       0
HEAVY SNOW                0     SNOW                       1
LIGHT SNOW               10     SLEET                      0
FOG                      19     FOG W/VIS <= 1/4 MILE      8
HAZE                     12

-  INDICATES NEGATIVE NUMBERS.
R  INDICATES RECORD WAS SET OR TIED.
MM INDICATES DATA IS MISSING.
T  INDICATES TRACE AMOUNT.
The past two months have brought periods of extreme cold but not a lot of snow to Denver. March however is our snowiest month and may bring a turnaround in those numbers. It also typically brings much warmer temperatures.
March is historically Denver’s snowiest month and brings about 20% of our annual snowfall. Heavy, wet spring snow storms can oftentimes bring the entire month’s snowfall total in one monstrous snow.
We also start the transition to spring and severe weather season and the month typically brings our first thunderstorms of the year. Temperatures climb throughout the month and by the end our average daytime highs are near 60 degrees.
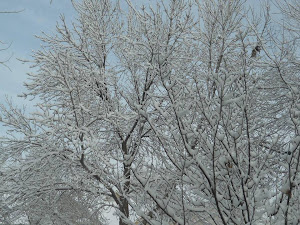
February started with a shot of snow in Thornton. (Jason McNeil)
The month of February is one that begins a transition to warmer temperatures and oftentimes lacks snowfall. Nevertheless, Mother Nature oftentimes offers stunning scenes to be captured in imagery as we see in our February 2014 slideshow.
Slideshow updated February 28, 2014
Showcasing images captured by ThorntonWeather.com readers as well as some of our own, our monthly slideshow covers the entire gamut of weather-related imagery. Sunsets, sunrises, wildlife and of course snow are vividly depicted.
Throughout the month we will gather the images sent to us via email or shared with us via our various social media outlets and post them in the slideshow below.
NASA’s Atmospheric Infrared Sounder (AIRS) instrument on NASA’s Aqua spacecraft shows the cold air pushed down from the Arctic in January 2014. (NASA)
Unseasonably cold weather gripped much of the nation in January and brought a term to public’s consciousness they may not have heard before: polar vortex. As explained in a video from NASA, the ‘stretching’ of the vortex was responsible for the record-setting cold seen last month.
NASA writes:
This movie of temperature observations from NASA’s Atmospheric Infrared Sounder (AIRS) instrument on NASA’s Aqua spacecraft depicts the first major North American weather event of 2014: cold air moving out of the Arctic and south to cover much of the continent. The temperatures shown are at a pressure of 850 hectopascals (hPa, formerly knows as millibars; sea level pressure is normally around 1000 hPa). Pressures of 850 hPa correspond to an altitude of about 3,000 feet (1 kilometer) above sea level. The temperatures in the movie range from about minus 18 degrees Fahrenheit (245 Kelvin or minus 28 degrees Celsius) to warmer than 66 degrees Fahrenheit (290 Kelvin or about 17 degrees Celsius). The very coldest temperatures in purples and blues are minus 18 to 17 degrees Fahrenheit (minus 28 to about minus 8 degrees Celsius).
The most obvious feature of the movie is the tongue of cold air moving out of Canada and southward to cover much of the eastern United States during early January 2014. This event was covered extensively in the media, and introduced the term ‘polar vortex’ to a broader audience.
This global perspective illustrates some features not noted in all the recent media attention. Perhaps most obvious: this is not a global phenomenon. The eastern half of the United States includes only about one percent of the total surface area of the planet (about two million of 197 million square miles). One advantage of satellite observations, as from AIRS, is coverage of the entire planet. A truly global perspective is required when studying variations in climate, and this event must be compared against a number of other phenomena occurring around the planet. Note that Alaska and northern Eurasia were warm during this period of unusual cold over the eastern United States.
One of our friends was hanging out along the South Platte again this afternoon. Had to shoot pictures into the sun but with the iridescent clouds in the background it looks really cool.
Cloud iridescence is caused by clouds (usually cirrus) that have small water droplets or ice crystals in them causing the light to be diffracted, or spread out. The phenomena is much like the rainbow colors seen with oil in water.
Remember we are always looking for pics of just about anything to add to our monthly slideshow. Be sure to email or post them so we can add them. Check out this month’s slideshow here.
A bald eagles rests in a tree along the South Platte River. (ThorntonWeather.com)
Weather, natural disasters & climate news and information.