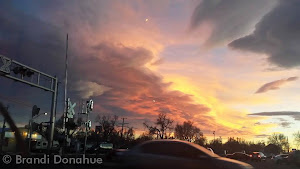
January 3, 2014 – Stunning wave cloud sunset as seen from Brighton. View more images in the slideshow below. (Brandi Donahue)
While typically a cold month, January is oftentimes lacking in terms of weather drama. Living in Colorado however provides plenty of opportunity to capture a wide variety of weather-related imagery as we see in our January 2014 slideshow.
Slideshow updated January 31, 2014
In this, our first monthly photo slideshow, we feature photos that not only we have taken but also those taken by ThorntonWeather.com fans.
Throughout the month we will gather the images sent to us via email or shared with us via our various social media outlets and post them in the slideshow below.
With us only being one week into the month, great photos of sunsets, wildlife, pets and wintry conditions have emerged. We love them all!
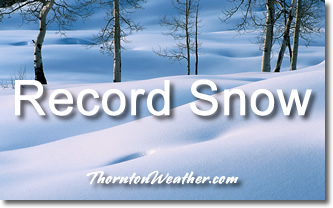
Thanks to a snowy start and a similarly snowy finish, the month of January 2014 climbed onto the list of top 10 January snow measurements in the Mile High City.
Officially the month ended with 14.3 inches of snowfall as measured at Denver International Airport. It was just enough to bump January 1991 from the number 10 spot (14.1 inches).
Here in Thornton we received just a bit less as we saw 13.4 inches of the white stuff.
January is only our fourth snowiest month with an average of 7.0 inches (based on 1981 to 2010 normals). The snowiest January on record occurred in 1992 when 24.3 inches of snow fell.
Looking at the 2013 / 2014 snow season, January helped make up some lost ground from the previous dry months.
The seasonal total now stands at 22.4 inches, 5.4 inches below the long term average of 27.8 inches we normally receive by the end of January. Thornton’s seasonal total is a bit better but still below normal at 24.2 inches.
The stage is set for Thornton to receive its most significant snowfall of the season thus far. Up in the high country snowfall will be measured in feet.
Here at lower elevations current forecasts are calling for 5 to 10 inches between Thursday and Friday afternoon. Many variables are in play that could affect the total that is eventually realized but this is certainly our best shot at a heavy snow thus far in the snow season.
We will be monitoring monitoring the storm very closely and posting regularly to our Facebook page and Twitter feed. You can follow along in real time below. We are also on Google+ here.
In a very brief period of time the forecast for the next 48 hours has changed considerably. The latest data indicates Thornton and the Colorado Front Range may be receiving a healthy dose of snow starting Thursday afternoon and lasting into Friday.
Abundant moisture streaming in from the Pacific coupled with a series of cold fronts stands to bring a wintry blast to the area. While the arrival is still a good ways out and much could change between now and when it gets here, the potential for a significant snow event exists.
The National Weather Service has issued a Winter Storm Watch for the Denver metro area and western plains. In effect from 3:00 p.m. Thursday through 3:00 p.m. Friday, the watch cautions that heavy snow will be possible.
Total forecast amounts are in the 3 to 6 inch range for the Denver area and 5 to 10 inches in the foothills. Bands of heavier snowfall are possible and could serve to drive those totals up. The Weather Prediction Center is giving at least a 40% chance of snowfall greater than or equal to 4 inches in our area.
The arrival later in the day Thursday should help to mitigate impacts to tomorrow’s commute home. However if this pans out as forecast, Friday morning’s drive to work may be a rough one.
With those forecast snowfall amounts comes the caveat that there is the possibility for less snowfall than mentioned above. A strong jet is overhead and while we expect upslope winds to help create a sustained snow event, should downslope flow prevail amounts will decrease.
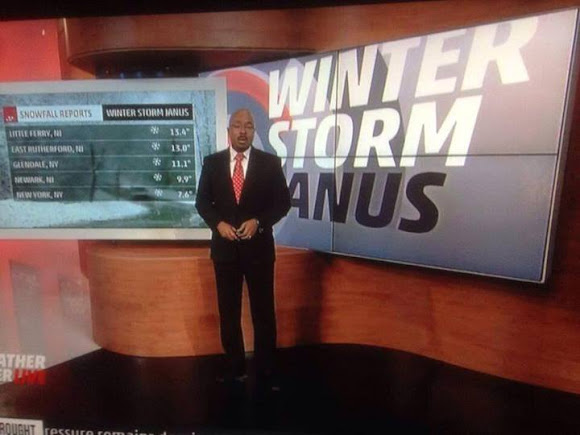
The Weather Channel’s naming of storms has never been a good idea. Now we see another reason why when a letter appears to be missing from this storm’s name. Click for a larger view.
Last year the Weather Channel unilaterally decided to start naming winter storms, a decision met with ridicule and concern from weather professionals. Now, with a storm TWC calls ‘Janus’, we very graphically can see another reason why the naming of these storms may not be a good idea.
The list the Weather Channel created for winter storms during the 2013 – 2014 season range contains everything from Latin words and Roman governors to mythological figures.
The channel is calling the current storm pounding the Northeast ‘Janus.’ Janus comes from Roman mythology and was considered the god of beginnings and transitions.
Setting aside the fact the naming of winter storms is ridiculous and only serves to confuse people in potentially dangerous situation, the display of the name during broadcasts has brought further ridicule.
Many graphics showing the word ‘Janus’ on TWC were partially obscured by their on air personalities and even their own imagery. The end result has been the appearance of the name without the ‘J’.
The Weather Channel’s naming of storms has never been a good idea. Now we see another reason why when a letter appears to be missing from this storm’s name.
Satellite imagery of wildfires is something we are certainly used to seeing here in Colorado, particularly the last couple of years. Summertime in Australia brings wildfire danger as well and a NASA satellite captured smoke billowing from a blaze down under.
Much of Australia has been gripped by record-setting heat in recent weeks thus leading to the increased fire danger. The image from NASA’s Aqua satellite shows one of the blazes burning.
From NASA:
“In January 2014, an intense heat wave and strong winds fueled an outbreak of hundreds of bushfires in South Australia. The Moderate Resolution Imaging Spectroradiometer (MODIS) on NASA’s Aqua satellite acquired this image of grass and shrub fires raging in Yumbarra Conservation Park on January 16, 2014. Red outlines indicate hot spots where MODIS detected unusually warm surface temperatures associated with fire. Northerly winds blew large plumes of smoke out over the Great Australian Bight. Members of the aboriginal community of Koonibba were preparing to evacuate as a large fire headed in the direction of the town, according to the Australian Broadcasting Company.”
NASA satellite image of wildfires and their smoke in Australia. (NASA)
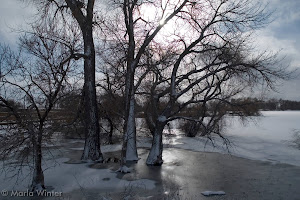
One example of an amazing image captured by a ThorntonWeather.com fan that will be featured in our monthly slideshows. (Marla Winter)
From stunning sunsets and impressive storms to cute snow-covered dogs and amazing wildlife, Coloradans witness amazing things every day. Starting today ThorntonWeather.com begins a new feature showcasing the imagery captured by cameras and we want YOUR pictures to share with others.
Colorado’s weather is anything but boring and virtually every day we are greeted with wonders large and small. Even in the quietest of weather conditions, the views of our landscape are stunningly varied from the vast plains to the east through the urban corridor of Denver and Thornton to the massive peaks towering over 14,000 feet high.
We all love our state and the wonders we see every day. ThorntonWeather.com wants to share what you see with others.
Our monthly photo slideshow is going to feature images that we have taken but more importantly images that you have captured. The photos can be of anything even remotely weather-related.
Landscapes, current conditions, wildlife, pets, kids. Whimsical, newsy, artsy. Taken at the zoo, some other area attraction, a local park, a national park or your backyard. You name it, we want to see and share it!
Images can be taken in Thornton, Denver or anywhere across the extraordinary Centennial State. We’ll even take some from out of state if we can tie it to Colorado somehow.
We’ll keep the criteria very open to interpretation with just about any image eligible to be shown in our slideshows.
What do you win for having your image in our slideshow? We are just a ‘mom and pop’ outfit and make no money from our site so we really don’t have the means to provide prizes. However you will have our undying gratitude and the satisfaction that your images are shared on the most popular website in Thornton.
To share you images with us and get them included in the slideshow just email them to us or share them with ThorntonWeather.com on any of the various social media outlets. Links are provided below.
Another year is in the books and as we look back at 2013’s weather, we see Thornton – and indeed much of the state – saw cooler and wetter than normal conditions.
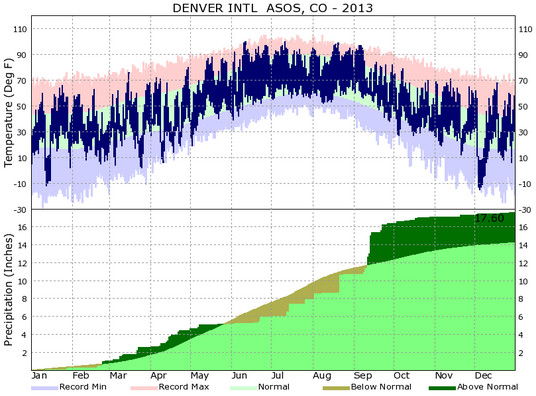
In terms of temperatures, Thornton saw an average overall annual temperature of 49.3 degrees. Out at Denver International Airport where the Mile High City’s official records are kept, the average was warmer at 50.1 degrees. By comparison, Denver’s 1981 to 2010 annual average temperature is 50.4 degrees.
Thornton recorded 47 days with temperatures at or above the 90 degree mark. At DIA 54 such days were recorded. Both were above the average of 40 90 degree days per year.
The hottest temperature recorded during the year in Thornton came on June 11th when the mercury climbed to 99.2 degrees. Denver’s hottest temperature of 100 degrees came on June 11th and July 11th.
At the opposite end of the thermometer, Thornton saw 175 days with low temperatures below freezing. Denver was very similar with 169 days with temperatures below 32 degrees. On average we expect to see 157 days below freezing.
Our coldest temperature in Thornton came last month on December 5th when the mercury dropped to -9.3 degrees. Denver’s occurred on the same date as the mercury at the airport dropped to -15 degrees.
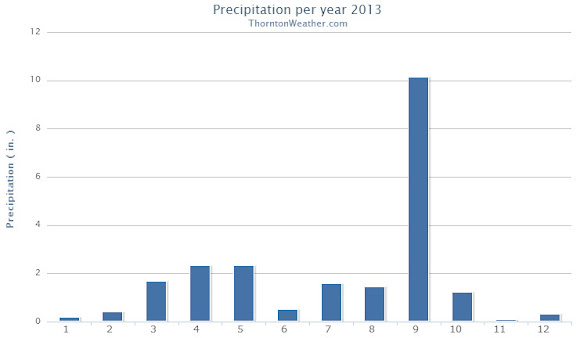
Precipitation for 2013 came in well above normal thanks largely in part to the extraordinary amount of rain received in September.
In all, Thornton saw 21.67 inches of liquid precipitation in our bucket. Denver, as always drier due to the station being at DIA, saw 17.60 inches. Both were above the annual average of 14.92 inches.
Above and by far the wettest month of the year was September and was responsible for the above average precipitation numbers. Thornton saw 10.15 inches in the rain bucket that month alone, Denver 5.61 inches.
Snowfall during the calendar year ended up relatively strong thanks to healthy totals from February through April. Overall the rest of the months of the year saw below normal snowfall.
Thornton’s annual snow total came in at an even 70.0 inches. Denver bested us with 74.1 inches during 2013.
Denver’s 2013 / 2014 season however has started out dismally with only 8.1 inches so far in the Mile High City. Thornton ended December a bit better with 10.8 inches. Both are well below the long term average that would have us see 21.2 inches by the end of the year.
Thornton, Colorado temperature summary chart for 2013.Thornton, Colorado precipitation summary for 2013.Denver, Colorado temperature and precipitation summary. (National Weather Service)
CLIMATE REPORT
NATIONAL WEATHER SERVICE BOULDER, CO
427 PM MST WED JAN 1 2014

...................................

...THE DENVER CO CLIMATE SUMMARY FOR THE YEAR OF 2013...

CLIMATE NORMAL PERIOD 1981 TO 2010
CLIMATE RECORD PERIOD 1872 TO 2013

WEATHER         OBSERVED          NORMAL  DEPART  LAST YEAR`S
                 VALUE   DATE(S)  VALUE   FROM    VALUE  DATE(S)
                                          NORMAL
................................................................
TEMPERATURE (F)
RECORD
 HIGH             105   06/26/2012
                        06/25/2012
                        07/20/2005
 LOW              -29   01/09/1875
HIGHEST           100   07/11        64      36      105  06/26
                        06/11                             06/25
LOWEST            -15   12/05        36     -51       -6  01/11
AVG. MAXIMUM     63.9              64.7    -0.8     68.4
AVG. MINIMUM     36.3              36.3     0.0     39.3
MEAN             50.1              50.5    -0.4     53.9
DAYS MAX >= 90     54              39.6    14.4       73
DAYS MAX <= 32     29              20.0     9.0       19
DAYS MIN <= 32    169             156.9    12.1      132
DAYS MIN <= 0      11               5.8     5.2        4

PRECIPITATION (INCHES)
RECORD
 MAXIMUM        23.31   1967
 MINIMUM         7.29   2008
TOTALS          17.60             14.30    3.30    10.11
DAILY AVG.       0.05              0.03    0.02     0.03
DAYS >= .01        82              79.7     2.3       52
DAYS >= .10        42              34.9     7.1       23
DAYS >= .50         8               7.6     0.4        9
DAYS >= 1.00        3               2.3     0.7        1
GREATEST
 24 HR. TOTAL    2.39   09/13 TO 09/14

 STORM TOTAL     4.65   09/09 TO 09/15

SNOWFALL (INCHES) RECORDS
TOTAL          115.9   1913
24 HR TOTAL     23.6   12/24/1982 TO 12/24/1982
SNOW DEPTH        MM   MM
TOTALS           72.1              53.8    18.3     38.5
 LIQUID EQUIV    5.40              5.40      MM     3.85
SINCE 7/1         8.1              22.5   -14.4     12.4
 LIQUID 7/1      0.81              2.20   -1.39     1.24
SNOWDEPTH AVG.      0                MM      MM        0
DAYS >= TRACE      60              33.3    26.7       36
DAYS >= 1.0        20              16.3     3.7       13
GREATEST
 SNOW DEPTH         9   02/25                         11  02/04
 24 HR TOTAL      9.1   02/24 TO 02/24              12.5  03/03
 STORM TOTAL     11.7   03/22 TO 03/24              15.9  03/02
                                                          03/04

DEGREE_DAYS
HEATING TOTAL    6302              6059     243     5198
 SINCE 7/1       2451              2468     -17     2233
COOLING TOTAL     999               769     230     1236
 SINCE 1/1        999               769     230     1236

FREEZE DATES
RECORD
 EARLIEST     09/08/1962
 LATEST       06/08/2007
EARLIEST                        10/07
LATEST                          05/05
..................................................

WIND (MPH)
AVERAGE WIND SPEED              9.7
RESULTANT WIND SPEED/DIRECTION   2/201
HIGHEST WIND SPEED/DIRECTION    64/060    DATE  06/18
HIGHEST GUST SPEED/DIRECTION    97/040    DATE  06/18

SKY COVER
POSSIBLE SUNSHINE (PERCENT)   MM
AVERAGE SKY COVER           0.60
NUMBER OF DAYS FAIR           69
NUMBER OF DAYS PC            232
NUMBER OF DAYS CLOUDY         64

AVERAGE RH (PERCENT)     52

WEATHER CONDITIONS. NUMBER OF DAYS WITH
THUNDERSTORM              0     MIXED PRECIP               0
HEAVY RAIN               14     RAIN                      25
LIGHT RAIN               80     FREEZING RAIN              0
LT FREEZING RAIN          4     HAIL                       0
HEAVY SNOW               11     SNOW                      23
LIGHT SNOW               58     SLEET                      0
FOG                     105     FOG W/VIS <= 1/4 MILE     33
HAZE                     88

-  INDICATES NEGATIVE NUMBERS.
R  INDICATES RECORD WAS SET OR TIED.
MM INDICATES DATA IS MISSING.
T  INDICATES TRACE AMOUNT.
As we begin the new year the winter chill begins to set in. While January can see its share of extremes, the month historically sees stable temperatures and is usually relatively dry.
January ranks as the second coldest month in Denver next to December with average temperatures remaining virtually the same from the start to the end of the month. In terms of snowfall, the month only ranks as the fourth snowiest and it is not uncommon for it to be quite dry.
What does January 2013 hold for us? Indications are that we may very well continue the recent pattern of below normal temperatures and relatively dry conditions.
 Thanks to a snowy start and a similarly snowy finish, the month of January 2014 climbed onto the list of top 10 January snow measurements in the Mile High City.
 The stage is set for Thornton to receive its most significant snowfall of the season thus far. Up in the high country snowfall will be measured in feet.
 In a very brief period of time the forecast for the next 48 hours has changed considerably. The latest data indicates Thornton and the Colorado Front Range may be receiving a healthy dose of snow starting Thursday afternoon and lasting into Friday.
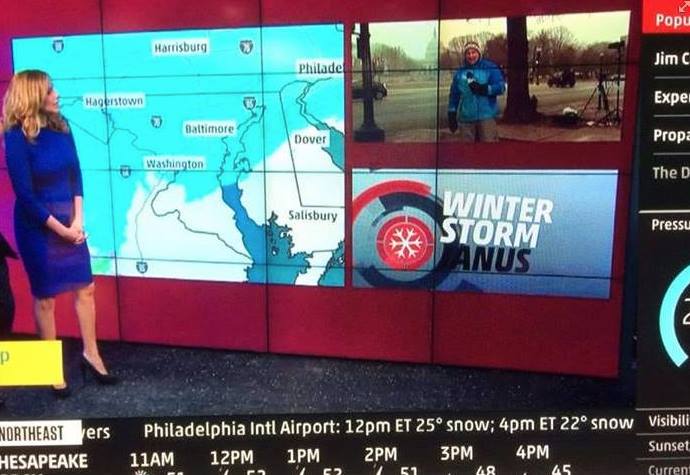

 Another year is in the books and as we look back at 2013’s weather, we see Thornton – and indeed much of the state – saw cooler and wetter than normal conditions.
 As we begin the new year the winter chill begins to set in. While January can see its share of extremes, the month historically sees stable temperatures and is usually relatively dry.