|
A newly discovered, roughly Earth-sized planet orbiting our nearest neighboring star might be habitable, according to a team of astronomers using the European Southern Observatory’s 3.6-meter telescope at La Silla, Chile, along with other telescopes around the world. The exoplanet is at a distance from its star that allows temperatures mild enough for liquid water to… Continue reading ESO Discovers Earth-Size Planet in Habitable Zone of Nearest Star |
Tag Archives: nasa
NASA satellite imagery shows California’s monstrous Blue Cut Fire

The Blue Cut Fire, just outside of Los Angeles, is a quickly growing fire that is currently an imminent threat to public safety, rail traffic and structures in the Cajon Pass, Lytle Creek, Wrightwood, Oak Hills, and surrounding areas. An estimated 34,500 homes and 82,640 people are being affected by the evacuation warnings that have been issued. This wildfire started on August 16, 2016 and the cause is unknown. In the last two days the fire has grown to 31,689 acres with 1584 personnel on scene. 178 engines, 26 crews, 10 air tankers, 2 Very Large Air Tankers (VLATS), and 17 Helicopters, including night flying helicopters. Additional firefighters and equipment have been ordered and will be responding directly to the fire. An unknown number of structures are damaged and destroyed. A smoke advisory has been issued for portions of San Bernardino Country.
Unfortunately extreme weather is continuing in the area with hot, dry and breezy (20 mph with gusts to 30 mph) conditions. Very poor relative humidity will continue. All of these will hinder fire fighting efforts and may increase fire spread.
NASA’s Suomi NPP satellite collected this natural-color image using the VIIRS (Visible Infrared Imaging Radiometer Suite) instrument on August 17, 2016. Actively burning areas, detected by thermal bands, are outlined in red. NASA image courtesy Jeff Schmaltz LANCE/EOSDIS MODIS Rapid Response Team, GSFC. Caption by Lynn Jenner with information from Inciweb.
Suomi NPP is managed by NASA, NOAA and the U.S. Department of Defense.
Last Updated: Aug. 18, 2016
Editor: Lynn Jenner
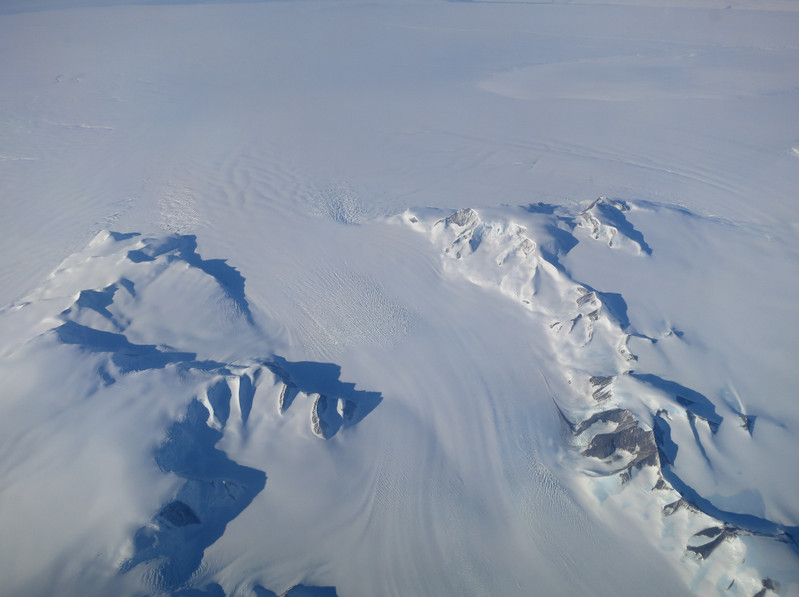
NASA Study: Mass Gains of Antarctic Ice Sheet Greater than Losses
Interesting. NASA study conflicts directly with much of the climate change narrative about ice in Antarctica.
A new NASA study says that an increase in Antarctic snow accumulation that began 10,000 years ago is currently adding enough ice to the continent to outweigh the increased losses from its thinning glaciers.
The research challenges the conclusions of other studies, including the Intergovernmental Panel on Climate Change’s (IPCC) 2013 report, which says that Antarctica is overall losing land ice.
According to the new analysis of satellite data, the Antarctic ice sheet showed a net gain of 112 billion tons of ice a year from 1992 to 2001. That net gain slowed to 82 billion tons of ice per year between 2003 and 2008.
“We’re essentially in agreement with other studies that show an increase in ice discharge in the Antarctic Peninsula and the Thwaites and Pine Island region of West Antarctica,” said Jay Zwally, a glaciologist with NASA Goddard Space Flight Center in Greenbelt, Maryland, and lead author of the study, which was published on Oct. 30 in the Journal of Glaciology. “Our main disagreement is for East Antarctica and the interior of West Antarctica – there, we see an ice gain that exceeds the losses in the other areas.” Zwally added that his team “measured small height changes over large areas, as well as the large changes observed over smaller areas.”
Scientists calculate how much the ice sheet is growing or shrinking from the changes in surface height that are measured by the satellite altimeters. In locations where the amount of new snowfall accumulating on an ice sheet is not equal to the ice flow downward and outward to the ocean, the surface height changes and the ice-sheet mass grows or shrinks.
But it might only take a few decades for Antarctica’s growth to reverse, according to Zwally. “If the losses of the Antarctic Peninsula and parts of West Antarctica continue to increase at the same rate they’ve been increasing for the last two decades, the losses will catch up with the long-term gain in East Antarctica in 20 or 30 years — I don’t think there will be enough snowfall increase to offset these losses.”
The study analyzed changes in the surface height of the Antarctic ice sheet measured by radar altimeters on two European Space Agency European Remote Sensing (ERS) satellites, spanning from 1992 to 2001, and by the laser altimeter on NASA’s Ice, Cloud, and land Elevation Satellite (ICESat) from 2003 to 2008.
Zwally said that while other scientists have assumed that the gains in elevation seen in East Antarctica are due to recent increases in snow accumulation, his team used meteorological data beginning in 1979 to show that the snowfall in East Antarctica actually decreased by 11 billion tons per year during both the ERS and ICESat periods. They also used information on snow accumulation for tens of thousands of years, derived by other scientists from ice cores, to conclude that East Antarctica has been thickening for a very long time.
“At the end of the last Ice Age, the air became warmer and carried more moisture across the continent, doubling the amount of snow dropped on the ice sheet,” Zwally said.
The extra snowfall that began 10,000 years ago has been slowly accumulating on the ice sheet and compacting into solid ice over millennia, thickening the ice in East Antarctica and the interior of West Antarctica by an average of 0.7 inches (1.7 centimeters) per year. This small thickening, sustained over thousands of years and spread over the vast expanse of these sectors of Antarctica, corresponds to a very large gain of ice – enough to outweigh the losses from fast-flowing glaciers in other parts of the continent and reduce global sea level rise.
Zwally’s team calculated that the mass gain from the thickening of East Antarctica remained steady from 1992 to 2008 at 200 billion tons per year, while the ice losses from the coastal regions of West Antarctica and the Antarctic Peninsula increased by 65 billion tons per year.
“The good news is that Antarctica is not currently contributing to sea level rise, but is taking 0.23 millimeters per year away,” Zwally said. “But this is also bad news. If the 0.27 millimeters per year of sea level rise attributed to Antarctica in the IPCC report is not really coming from Antarctica, there must be some other contribution to sea level rise that is not accounted for.”
“The new study highlights the difficulties of measuring the small changes in ice height happening in East Antarctica,” said Ben Smith, a glaciologist with the University of Washington in Seattle who was not involved in Zwally’s study.
“Doing altimetry accurately for very large areas is extraordinarily difficult, and there are measurements of snow accumulation that need to be done independently to understand what’s happening in these places,” Smith said.
To help accurately measure changes in Antarctica, NASA is developing the successor to the ICESat mission, ICESat-2, which is scheduled to launch in 2018. “ICESat-2 will measure changes in the ice sheet within the thickness of a No. 2 pencil,” said Tom Neumann, a glaciologist at Goddard and deputy project scientist for ICESat-2. “It will contribute to solving the problem of Antarctica’s mass balance by providing a long-term record of elevation changes.”
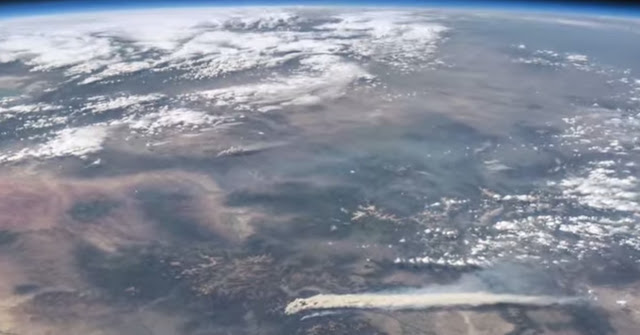
Satellite imagery shows devastating Canadian wildfire
A fast-moving wildfire burning near Fort McMurray, Alberta has prompted the evacuation of all 88,000 residents of the city. Since the fire started Sunday, at least 1,600 structures have been destroyed.
NASA’s Earth Observatory trained one of its satellites on the area – see below. Read more about the blaze here.
Wildfire Spreads in Fort McMurray
On May 4, 2016, the the Enhanced Thematic Mapper Plus (ETM+) on the Landsat 7 satellite acquired this false-color image of the wildfire that burned through Fort McMurray in Alberta, Canada. The image combines shortwave infrared, near infrared, and green light (bands 5-4-2). Near- and short-wave infrared help penetrate clouds and smoke to reveal the hot spots associated with active fires, which appear red. Smoke appears white and burned areas appear brown.

Two Mysteries About Wobbling Earth Have Been Solved
|
Carol Rasmussen, NASA Using satellite data on how water moves around Earth, NASA scientists have solved two mysteries about wobbles in the planet’s rotation – one new and one more than a century old. The research may help improve our knowledge of past and future climate. Although a desktop globe always spins smoothly around the axis… Continue reading Two Mysteries About Wobbling Earth Have Been Solved |
Relieved? NASA opens Planetary Defense Coordination Office
|
If a monster asteroid is headed towards Earth, perhaps the planet is a little more prepared. NASA announced Friday that the Planetary Defense Coordination Office is now open for business, tasked with a succinct mission: to track and characterizing all asteroids and comets that veer too close to Earth – and figure out a response to… Continue reading Relieved? NASA opens Planetary Defense Coordination Office |
NASA Outlines Plan For Humanity’s Journey To Mars
|
Mars, despite its inhospitable climate and heavily irradiated surface that would kill humans in a matter of minutes, has been a source of unending fascination for scientists and science fiction writers alike. In recent years, this fascination has translated into concrete plans for a manned mission to the red planet, with the goal of eventually establishing… Continue reading NASA Outlines Plan For Humanity’s Journey To Mars |
Global warming: Deceptive temperature record claims
|
The U.S. government is at it again, hyping meaningless records in a parameter that does not exist in order to frighten us about something that doesn’t matter. NASA and the National Oceanic and Atmospheric Administration (NOAA) announced this week that according to their calculations, July 2015 was the hottest month since instrumental records began in 1880.… Continue reading Global warming: Deceptive temperature record claims |
NASA Images of Hurricane Katrina and 2005 Storm Season Available
|
GREENBELT, Md., Aug. 12, 2015 /PRNewswire-USNewswire/ — To mark the tenth anniversary of Hurricane Katrina this month, NASA is making available to media a special collection of videos and still images associated with the devastating storm and the record-breaking 2005 Atlantic hurricane season. The main web link to use for all the best video and still… Continue reading NASA Images of Hurricane Katrina and 2005 Storm Season Available |
Video: NASA showcases weather and climate events of 2013 as seen from space
A stunning video released by NASA this week provides a bird’s eye view of some of the Earth’s most significant weather and climate events of last year.
Using images and movies from satellites and the International Space Station, scenes from across the globe are shown in the video titled “Earth from Orbit 2013.”
Colorado and surrounding states however will draw the most attention from many locally.
From their perch high above, imagery of Colorado’s West Fork Fire in June 2013 is seen as well as the effects of the September floods.
To our south, the drought in New Mexico is seen having taken its toll on Elephant Butte Reservoir in New Mexico. The veritable explosion of storm cells that lea to devastation in Oklahoma during a May tornado outbreak are also shown.
Below the video you will find a description of each scene and links to more imagery.
From NASA – Published on Apr 21, 2014:
A fleet of orbiting satellites monitors Earth constantly. The satellites from NASA and other space agencies give us a fresh, wide perspective on things that we can see from the ground — and things that we can’t.
A look back at Earth in 2013 from the viewpoint of orbit reveals the kind of data gathering and technical achievement that are the reason NASA puts Earth-observing satellites in space. A visualization of satellite and computer model data shows how a cloud of dust from the Chelyabinsk meteor moved around the world. NASA satellites measured the intensity of wildfires, the salinity of the oceans and rainfall around the globe — whether it was too little or too much.
To learn more about NASA’s Earth science in 2014, please visit: www.nasa.gov/earthrightnow
Imagery used in this video, in order:
Views of a Distant Earth
http://earthobservatory.nasa.gov/IOTD…
Earth and Moon
http://svs.gsfc.nasa.gov/vis/a000000/…
Current Earth Observing Fleet
http://svs.gsfc.nasa.gov/vis/a030000/…
Term3_ISS From Night to Day to Night Again
http://eol.jsc.nasa.gov/Videos/CrewEa…
Astronaut View of Fires in Colorado
http://earthobservatory.nasa.gov/Natu…
Extensive Ice Fractures in the Beaufort Sea
http://earthobservatory.nasa.gov/IOTD…
Dune Movement Around Aorounga
http://earthobservatory.nasa.gov/IOTD…
San Francisco Region at Night
http://earthobservatory.nasa.gov/IOTD…
Whiting Event, Lake Ontario
http://earth.jsc.nasa.gov/debrief/ISS…
Dust Plumes over the Mediterranean
http://earthobservatory.nasa.gov/Natu…
Mt. St. Helens
http://earthobservatory.nasa.gov/IOTD…
El Paso
http://earthobservatory.nasa.gov/IOTD…
Close-Up of Flooding in Mozambique
http://earthobservatory.nasa.gov/IOTD…
Drought Dries Elephant Butte Reservoir
http://earthobservatory.nasa.gov/IOTD…
Oklahoma Tornadoes
http://earthobservatory.nasa.gov/Natu…
Floods in Colorado
http://earthobservatory.nasa.gov/Natu…
Pavlof Volcano
http://earthobservatory.nasa.gov/Natu…
Swirling Sediment Reveals Erosive Power of New England Storm
http://earthobservatory.nasa.gov/IOTD…
Never at Rest: The Air over Los Angeles
http://svs.gsfc.nasa.gov/vis/a000000/…
Measuring Soil Moisture from Space
http://svs.gsfc.nasa.gov/vis/a030000/…
Antarctic Bedrock
http://svs.gsfc.nasa.gov/vis/a000000/…
Seeing Photosynthesis from Space
http://svs.gsfc.nasa.gov/vis/a010000/…
Greenland’s Mega Canyon
http://svs.gsfc.nasa.gov/vis/a000000/…
Chelyabinsk Bolide Plume as seen by NPP and NASA Models
http://svs.gsfc.nasa.gov/vis/a000000/…
Narrated Distributed Water Balance of the Nile Basin
http://svs.gsfc.nasa.gov/vis/a010000/…
NEO Observations (various)
http://svs.gsfc.nasa.gov/cgi-bin/advs…