July 2014 will go into the history books as one of the wettest on record in the Mile High City. A healthy monsoon flow also contributed to overall below normal temperatures.
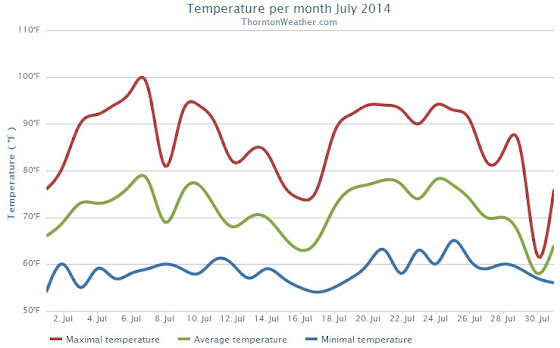
The month started out cooler than normal but the third of the month brought a string of 90 plus degree days that lasted until the 11th of the month with only one day not reaching the mark during that time.
Cooler temperatures arrived for the next seven days with three of those seeing highs only in the 70s. A healthy shot of moisture on the 11th turned lawns green.
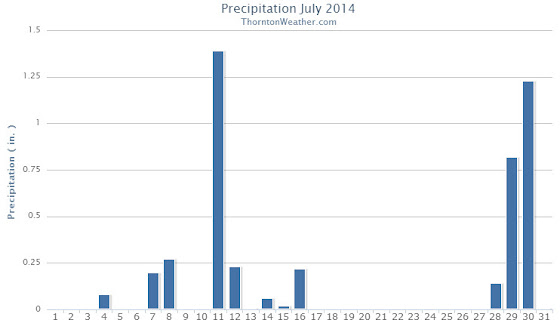
We bounced right back to the 90s on the 19th but then saw the cool weather return on the 27th. Light rain on the 28th was followed by heavy rain on the 29th and 30th pushing the month into the rain fall record books.
The 30th of the month was notable for a record setting low maximum temperature with a reading more like we would expect to see in April or October.
Thornton saw an overall average temperature for July 2014 of 71.5 degrees. This is well below the Denver July average of 74.2 degrees.
As measured at Denver International Airport, the Mile High City’s official reading was warmer than ours with an average of 74.5. The airport’s location further east allows it to hold off seeing the typical afternoon clouds for a bit longer than areas to the west and thus it typically sees warmer temperatures.
Our warmest temperature reading of the month was 98.2 degrees on the 7th. Thornton recorded 16 days of 90 degree or warmer temperatures. Conversely, our coldest reading was 54.1 degrees on the first of the month.
Denver’s maximum reading also occurred on the 7th but was warmer at 100 degrees. The airport saw 17 days with reading of 90 degrees or higher. The lowest reading of the month was 55 degrees on the 16th and 17th.
One temperature record was set during July. On the 30th the maximum temperature only reached 62 degrees (Thornton recorded 62.2 degrees). This broke the record low maximum for the date of 64 degrees set in 2009.
In terms of precipitation, there was plenty of it across the board.
Denver averages 2.16 inches during July. In Thornton we recorded a healthy 4.69 inches while Denver officially saw 3.85 inches.
For both locations, nearly half of those totals came on the 29th and 30th. The Denver total puts it into the books as one of the wettest Julys on record. Additionally, the Denver total on the 29th set a record for that date.
Click here to view Thornton’s July 2014 climate report.
CLIMATE REPORT
NATIONAL WEATHER SERVICE BOULDER, CO
550 AM MDT FRI AUG 1 2014

...................................

...THE DENVER CO CLIMATE SUMMARY FOR THE MONTH OF JULY 2014...

CLIMATE NORMAL PERIOD 1981 TO 2010
CLIMATE RECORD PERIOD 1872 TO 2014

WEATHER         OBSERVED          NORMAL  DEPART  LAST YEAR`S
                 VALUE   DATE(S)  VALUE   FROM    VALUE  DATE(S)
                                          NORMAL
................................................................
TEMPERATURE (F)
RECORD
HIGH             105   07/20/2005
LOW               42   07/04/1903
                        07/31/1873
HIGHEST           100   07/07       105      -5      100  07/11
LOWEST             55   07/17        42      13       55  07/02
                        07/16
AVG. MAXIMUM     88.3              89.4    -1.1     88.2
AVG. MINIMUM     60.6              58.9     1.7     60.4
MEAN             74.5              74.2     0.3     74.3
DAYS MAX >= 90     17              16.0     1.0       17
DAYS MAX <= 32      0               0.0     0.0        0
DAYS MIN <= 32      0               0.0     0.0        0
DAYS MIN <= 0       0               0.0     0.0        0

PRECIPITATION (INCHES)
RECORD
MAXIMUM         6.41   1965
MINIMUM         0.01   1901
TOTALS           3.85              2.16    1.69     1.98
DAILY AVG.       0.12              0.07    0.05     0.06
DAYS >= .01         8               8.3    -0.3        7
DAYS >= .10         6               4.3     1.7        4
DAYS >= .50         2               1.4     0.6        2
DAYS >= 1.00        2               0.7     1.3        0
GREATEST
24 HR. TOTAL    2.85   07/29 TO 07/30

SNOWFALL (INCHES)
RECORDS
TOTAL            0.0
TOTALS            0.0               0.0

DEGREE_DAYS
HEATING TOTAL       5                 6      -1        0
SINCE 7/1          5                 6      -1        0
COOLING TOTAL     304               289      15      295
SINCE 1/1        431               444     -13      558

FREEZE DATES
RECORD
EARLIEST     09/08/1962
LATEST       06/08/2007
EARLIEST                        10/07
LATEST                          05/05
......................................................

WIND (MPH)
AVERAGE WIND SPEED              9.7
RESULTANT WIND SPEED/DIRECTION   3/193
HIGHEST WIND SPEED/DIRECTION    51/310    DATE  07/11
HIGHEST GUST SPEED/DIRECTION    51/290    DATE  07/11

SKY COVER
POSSIBLE SUNSHINE (PERCENT)   MM
AVERAGE SKY COVER           0.60
NUMBER OF DAYS FAIR            4
NUMBER OF DAYS PC             24
NUMBER OF DAYS CLOUDY          3

AVERAGE RH (PERCENT)     51

WEATHER CONDITIONS. NUMBER OF DAYS WITH
THUNDERSTORM              0     MIXED PRECIP               0
HEAVY RAIN                2     RAIN                       7
LIGHT RAIN               13     FREEZING RAIN              0
LT FREEZING RAIN          0     HAIL                       0
HEAVY SNOW                0     SNOW                       0
LIGHT SNOW                0     SLEET                      0
FOG                       8     FOG W/VIS <= 1/4 MILE      1
HAZE                      7

-  INDICATES NEGATIVE NUMBERS.
R  INDICATES RECORD WAS SET OR TIED.
MM INDICATES DATA IS MISSING.
T  INDICATES TRACE AMOUNT.