The last full summer month of the year has come to a close in a rather un-dramatic fashion. Thornton saw a largely pleasant month with temperatures a good bit cooler than we usually expect to see. Precipitation was right near normal however, all of it fell during the first half of the month.
High pressure ruled for the first two days of the month but then the ridge broke down bringing about cooler temperatures on the 3rd of the month. The cool down didn’t last long and while the heat returned for a couple of days, we did finally receive some moisture on the 4th and 5th.
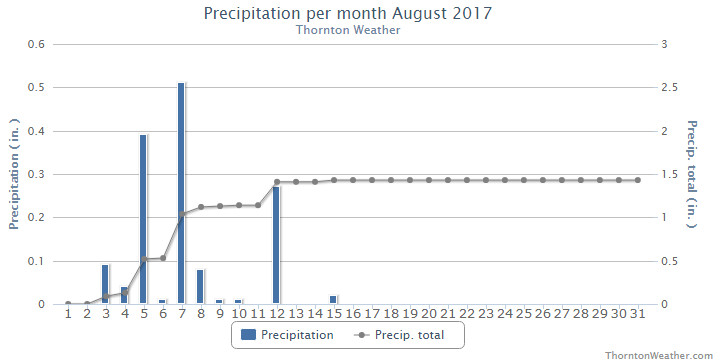
Cooler than normal temperatures returned on the 6th and lasted through the next 10 days. The first half of the month also saw 10 days with measurable precipitation, our only precipitation for the month as the last half of the month saw none at all.
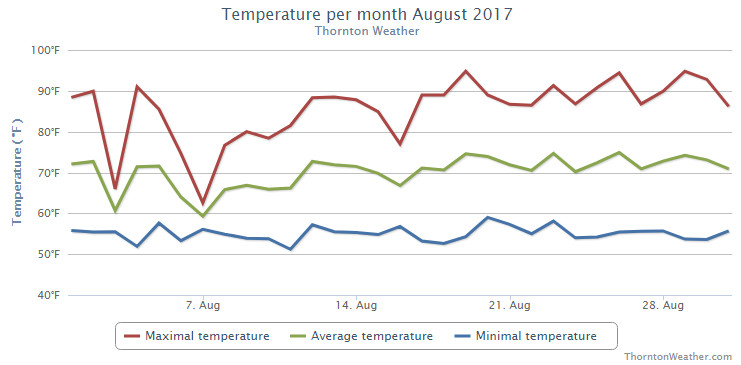
Dry and warm conditions were the rule of thumb for the last two weeks of the month. Both Thornton and Denver saw six of the last nine days of the month bring high temperatures at or above 90 degrees.
Our average temperature for the month came in at 68.9 degrees. This was a good bit below the long term Denver average for August of 72.5 degrees. Out at DIA where the Mile High City’s official measurements are taken, the month was warmer than us but still cooler than normal with an average of 71.5 degrees.
Temperatures in Thornton ranged from a high mark reading of 94.9 degrees on the 29th of the month down to a low of 51.2 degrees on the 11th. Denver saw a maximum reading of 95 degrees on the 19th of the month and a low of 51 degrees on the 4th.
In terms of precipitation, Denver averages 1.69 inches of precipitation during August. Thornton wasn’t too far short of that with 1.43 inches. However, all of that came during the first 15 days of the month. After that, we saw nothing. Denver best us, and the average, with 1.86 inches in their rain bucket.
Click here to view Thornton’s August 2017 climate report.
CLIMATE REPORT
NATIONAL WEATHER SERVICE DENVER/BOULDER CO
639 PM MDT FRI SEP 1 2017

...................................

...THE DENVER CO CLIMATE SUMMARY FOR THE MONTH OF AUGUST 2017...

CLIMATE NORMAL PERIOD 1981 TO 2010
CLIMATE RECORD PERIOD 1872 TO 2017

WEATHER         OBSERVED          NORMAL  DEPART  LAST YEAR`S
                 VALUE   DATE(S)  VALUE   FROM    VALUE  DATE(S)
                                          NORMAL
................................................................
TEMPERATURE (F)
RECORD
 HIGH             105   08/08/1878
 LOW               40   08/26/1910
                        08/25/1910
                        08/24/1910
HIGHEST            95   08/19        96      -1       97  08/09
LOWEST             51   08/04        50       1       47  08/25
                                                          08/20
AVG. MAXIMUM     85.7              87.2    -1.5     86.3
AVG. MINIMUM     57.3              57.9    -0.6     56.2
MEAN             71.5              72.5    -1.0     71.2
DAYS MAX >= 90     10              11.5    -1.5       15
DAYS MAX <= 32      0               0.0     0.0        0
DAYS MIN <= 32      0               0.0     0.0        0
DAYS MIN <= 0       0               0.0     0.0        0

PRECIPITATION (INCHES)
RECORD
 MAXIMUM         5.85   1979
 MINIMUM         0.02   1924
TOTALS           1.86              1.69    0.17     0.22
DAILY AVG.       0.06              0.05    0.01     0.01
DAYS >= .01         6               8.6    -2.6        4
DAYS >= .10         4               4.3    -0.3        1
DAYS >= .50         2               1.2     0.8        0
DAYS >= 1.00        0               0.3    -0.3        0
GREATEST
 24 HR. TOTAL    0.90   08/07 TO 08/07           08/24 TO 08/24

SNOWFALL (INCHES)
RECORDS TOTAL     0.0
TOTALS            0.0 2017          0.0


DEGREE_DAYS
HEATING TOTAL       8                10      -2       15
 SINCE 7/1          8                16      -8       15
COOLING TOTAL     216               244     -28      218
 SINCE 1/1        749               688      61      762

FREEZE DATES
RECORD
 EARLIEST     09/08/1962
 LATEST       06/08/2007
EARLIEST                        10/07
LATEST                          05/05
.........................................................

WIND (MPH)
AVERAGE WIND SPEED              9.2
RESULTANT WIND SPEED/DIRECTION   2/189
HIGHEST WIND SPEED/DIRECTION    49/320    DATE  08/04
HIGHEST GUST SPEED/DIRECTION    62/320    DATE  08/04

SKY COVER
POSSIBLE SUNSHINE (PERCENT)   MM
AVERAGE SKY COVER           0.50
NUMBER OF DAYS FAIR            7
NUMBER OF DAYS PC             21
NUMBER OF DAYS CLOUDY          3

AVERAGE RH (PERCENT)     50

WEATHER CONDITIONS. NUMBER OF DAYS WITH
THUNDERSTORM             13     MIXED PRECIP               0
HEAVY RAIN                3     RAIN                       4
LIGHT RAIN               12     FREEZING RAIN              0
LT FREEZING RAIN          0     HAIL                       0
HEAVY SNOW                0     SNOW                       0
LIGHT SNOW                0     SLEET                      0
FOG                      10     FOG W/VIS <= 1/4 MILE      2
HAZE                      2

-  INDICATES NEGATIVE NUMBERS.
R  INDICATES RECORD WAS SET OR TIED.
MM INDICATES DATA IS MISSING.
T  INDICATES TRACE AMOUNT.