The Russian climate change research vessel Akadmik Shokalskiy is seen stuck in ice near Antarctica.
A Russian research ship stuck in expanding Antarctic ice and a Chinese ice breaker sent to help have put out calls for further assistance and the U.S. Coast Guard is responding.
The Akadmik Shokalskiy became stuck in the ice on December 24. Tourists, scientists and journalists were on board the Russian ship conducting global warming research.
Chinese icebreaker Xue Long was dispatched to rescue the trapped researchers. Using its helicopters it was able to airlift dozens of passengers to a second rescue ship, the Aurora Australis, on Thursday. However, the Xue Long soon found itself stuck in the expanding ice.
Last week the Australian government asked the United States for assistance in clearing the way for the two ships and yesterday it was announced the U.S. Coast Guard would dispatch one of its largest ships to help.
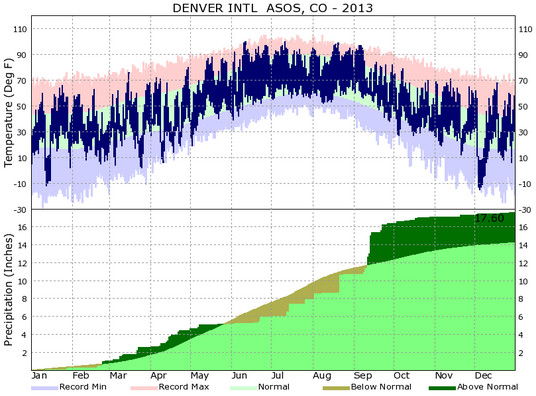
Another year is in the books and as we look back at 2013’s weather, we see Thornton – and indeed much of the state – saw cooler and wetter than normal conditions.
In terms of temperatures, Thornton saw an average overall annual temperature of 49.3 degrees. Out at Denver International Airport where the Mile High City’s official records are kept, the average was warmer at 50.1 degrees. By comparison, Denver’s 1981 to 2010 annual average temperature is 50.4 degrees.
Thornton recorded 47 days with temperatures at or above the 90 degree mark. At DIA 54 such days were recorded. Both were above the average of 40 90 degree days per year.
The hottest temperature recorded during the year in Thornton came on June 11th when the mercury climbed to 99.2 degrees. Denver’s hottest temperature of 100 degrees came on June 11th and July 11th.
At the opposite end of the thermometer, Thornton saw 175 days with low temperatures below freezing. Denver was very similar with 169 days with temperatures below 32 degrees. On average we expect to see 157 days below freezing.
Our coldest temperature in Thornton came last month on December 5th when the mercury dropped to -9.3 degrees. Denver’s occurred on the same date as the mercury at the airport dropped to -15 degrees.
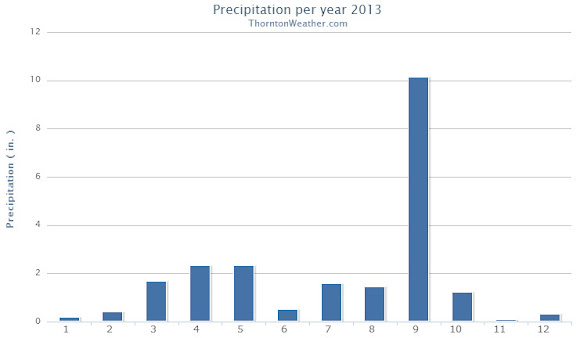
Precipitation for 2013 came in well above normal thanks largely in part to the extraordinary amount of rain received in September.
In all, Thornton saw 21.67 inches of liquid precipitation in our bucket. Denver, as always drier due to the station being at DIA, saw 17.60 inches. Both were above the annual average of 14.92 inches.
Above and by far the wettest month of the year was September and was responsible for the above average precipitation numbers. Thornton saw 10.15 inches in the rain bucket that month alone, Denver 5.61 inches.
Snowfall during the calendar year ended up relatively strong thanks to healthy totals from February through April. Overall the rest of the months of the year saw below normal snowfall.
Thornton’s annual snow total came in at an even 70.0 inches. Denver bested us with 74.1 inches during 2013.
Denver’s 2013 / 2014 season however has started out dismally with only 8.1 inches so far in the Mile High City. Thornton ended December a bit better with 10.8 inches. Both are well below the long term average that would have us see 21.2 inches by the end of the year.
Thornton, Colorado temperature summary chart for 2013.Thornton, Colorado precipitation summary for 2013.Denver, Colorado temperature and precipitation summary. (National Weather Service)
CLIMATE REPORT
NATIONAL WEATHER SERVICE BOULDER, CO
427 PM MST WED JAN 1 2014

...................................

...THE DENVER CO CLIMATE SUMMARY FOR THE YEAR OF 2013...

CLIMATE NORMAL PERIOD 1981 TO 2010
CLIMATE RECORD PERIOD 1872 TO 2013

WEATHER         OBSERVED          NORMAL  DEPART  LAST YEAR`S
                 VALUE   DATE(S)  VALUE   FROM    VALUE  DATE(S)
                                          NORMAL
................................................................
TEMPERATURE (F)
RECORD
 HIGH             105   06/26/2012
                        06/25/2012
                        07/20/2005
 LOW              -29   01/09/1875
HIGHEST           100   07/11        64      36      105  06/26
                        06/11                             06/25
LOWEST            -15   12/05        36     -51       -6  01/11
AVG. MAXIMUM     63.9              64.7    -0.8     68.4
AVG. MINIMUM     36.3              36.3     0.0     39.3
MEAN             50.1              50.5    -0.4     53.9
DAYS MAX >= 90     54              39.6    14.4       73
DAYS MAX <= 32     29              20.0     9.0       19
DAYS MIN <= 32    169             156.9    12.1      132
DAYS MIN <= 0      11               5.8     5.2        4

PRECIPITATION (INCHES)
RECORD
 MAXIMUM        23.31   1967
 MINIMUM         7.29   2008
TOTALS          17.60             14.30    3.30    10.11
DAILY AVG.       0.05              0.03    0.02     0.03
DAYS >= .01        82              79.7     2.3       52
DAYS >= .10        42              34.9     7.1       23
DAYS >= .50         8               7.6     0.4        9
DAYS >= 1.00        3               2.3     0.7        1
GREATEST
 24 HR. TOTAL    2.39   09/13 TO 09/14

 STORM TOTAL     4.65   09/09 TO 09/15

SNOWFALL (INCHES) RECORDS
TOTAL          115.9   1913
24 HR TOTAL     23.6   12/24/1982 TO 12/24/1982
SNOW DEPTH        MM   MM
TOTALS           72.1              53.8    18.3     38.5
 LIQUID EQUIV    5.40              5.40      MM     3.85
SINCE 7/1         8.1              22.5   -14.4     12.4
 LIQUID 7/1      0.81              2.20   -1.39     1.24
SNOWDEPTH AVG.      0                MM      MM        0
DAYS >= TRACE      60              33.3    26.7       36
DAYS >= 1.0        20              16.3     3.7       13
GREATEST
 SNOW DEPTH         9   02/25                         11  02/04
 24 HR TOTAL      9.1   02/24 TO 02/24              12.5  03/03
 STORM TOTAL     11.7   03/22 TO 03/24              15.9  03/02
                                                          03/04

DEGREE_DAYS
HEATING TOTAL    6302              6059     243     5198
 SINCE 7/1       2451              2468     -17     2233
COOLING TOTAL     999               769     230     1236
 SINCE 1/1        999               769     230     1236

FREEZE DATES
RECORD
 EARLIEST     09/08/1962
 LATEST       06/08/2007
EARLIEST                        10/07
LATEST                          05/05
..................................................

WIND (MPH)
AVERAGE WIND SPEED              9.7
RESULTANT WIND SPEED/DIRECTION   2/201
HIGHEST WIND SPEED/DIRECTION    64/060    DATE  06/18
HIGHEST GUST SPEED/DIRECTION    97/040    DATE  06/18

SKY COVER
POSSIBLE SUNSHINE (PERCENT)   MM
AVERAGE SKY COVER           0.60
NUMBER OF DAYS FAIR           69
NUMBER OF DAYS PC            232
NUMBER OF DAYS CLOUDY         64

AVERAGE RH (PERCENT)     52

WEATHER CONDITIONS. NUMBER OF DAYS WITH
THUNDERSTORM              0     MIXED PRECIP               0
HEAVY RAIN               14     RAIN                      25
LIGHT RAIN               80     FREEZING RAIN              0
LT FREEZING RAIN          4     HAIL                       0
HEAVY SNOW               11     SNOW                      23
LIGHT SNOW               58     SLEET                      0
FOG                     105     FOG W/VIS <= 1/4 MILE     33
HAZE                     88

-  INDICATES NEGATIVE NUMBERS.
R  INDICATES RECORD WAS SET OR TIED.
MM INDICATES DATA IS MISSING.
T  INDICATES TRACE AMOUNT.
As we begin the new year the winter chill begins to set in. While January can see its share of extremes, the month historically sees stable temperatures and is usually relatively dry.
January ranks as the second coldest month in Denver next to December with average temperatures remaining virtually the same from the start to the end of the month. In terms of snowfall, the month only ranks as the fourth snowiest and it is not uncommon for it to be quite dry.
What does January 2013 hold for us? Indications are that we may very well continue the recent pattern of below normal temperatures and relatively dry conditions.
The best photos of 2013 as seen through ThorntonWeather.com’s lenses. View the slideshow below.
Colorado’s weather and scenery can certainly be dramatic and the past year has been no different. Armed with our camera, we captured hundreds of images and shared them with our readers.
While we are entirely amateur photographers, sometimes Colorado makes it hard to take a bad picture. Over the course of 2013 we took hundreds of photos, many of which were shared with you on Facebook, Google+ and Twitter.
Picking which of the images we liked the best was not easy. The subject matter ranged from weather to wildlife to expansive landscapes and even heavenly bodies.
As we sorted through we couldn’t help but notice the lack of real weather drama in the photos we took. While there were wildfires to our south and floods to the north, Thornton managed to escape the year relatively unscathed from Mother Nature’s wrath.
We also were unable to do any real storm chasing so severe weather imagery was lacking. Hopefully that can be rectified in 2014. 😉
When all was said and done we came up with 25 images that we thought were our best photos of the year. You can view them in the slideshow below. Leave a comment here or on our social media pages and let us know what you think.
Remember too that we love seeing your photos so be sure to share them with us!
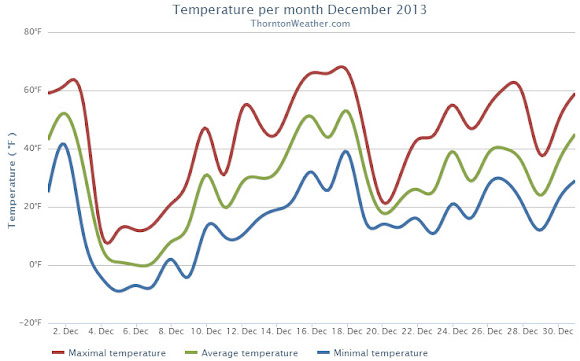
Thornton and the Denver area closed out 2013 with a display of typically highly variable weather. We recorded some record low temperatures followed by unseasonably warm conditions. One thing that was lacking was snow.
The first three days of the month started out quite mild with highs well above normal. That changed quickly midday on the third as low pressure moved in bringing an extended Arctic blast.
For six straight days high temperatures remained stubbornly below freezing and lows dipped into the single digits. The cold snap was notable but not record-setting in terms of length. Two daily low temperature records were tied or broken however.
Warmer weather returned on the 10th as the mercury finally started to climb. Unseasonably warm temperatures became the rule for the next nine days that included a record high temperature on the 18th.
The last third of the month was a bit more variable with its ups and downs but overall warmer than normal conditions.
Overall Thornton’s monthly average temperature came in at 29.2 degrees. Out at Denver International Airport where the Mile High City’s official stats are recorded, it was a bit cooler with an average of 28.4 degrees. Both were below Denver’s December average of 30.0 degrees.
Thornton recorded nine days with high temperatures that failed to reach 32 degrees. On five days, low temperatures dropped below zero. Denver saw eight days with highs below freezing, six with lows below zero.
The warmest temperature of the month in Thornton came on the 18th when we recorded 66.8 degrees. Our coldest was -9.3 degrees on the 5th. Denver’s warmest day was on the 18th as well with a high of 68 degrees. Its lowest temperature was -15 degrees on the 5th.
Four temperature records were tied or broken in Denver.
The low temperature of -13 degrees on December 4th shattered the old record low for the date of -5 degrees last set in 2008. The following day, on December 5th, the low temperature of -15 degrees tied the record low last set in 1972.
The mild weather December 18 saw two records. The high of 68 degrees broke the previous high temperature record for the date of 66 degrees last set in 1979. Also, the day tied the record high minimum for the 18th of 40 degrees set in 1917.
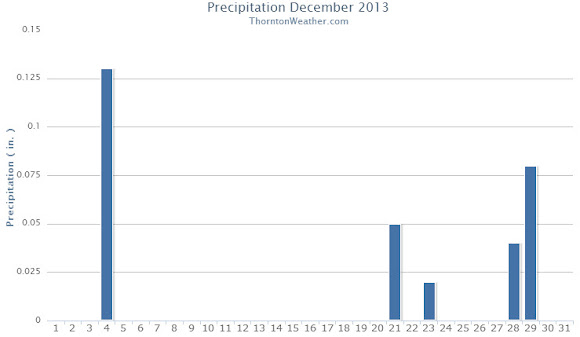
Precipitation for the month of December 2013 was not as noteworthy as the temperatures. Thornton recorded only 0.24 inches in our bucket while Denver received 0.25 inches. Both were a good bit below the December average of 0.35 inches.
Snow was similarly less than extraordinary. Thornton measured 5.7 inches of the white stuff while Denver lagged that with 4.7 inches. Both totals were below the normal for December of 8.5 inches. Seasonal snowfall totals at this point are about half of what they normally are.
Thornton’s December 2013 Temperatures.Thornton’s December 2013 Precipitation.
CLIMATE REPORT
NATIONAL WEATHER SERVICE BOULDER, CO
200 AM MST WED JAN 1 2014

...................................

...THE DENVER CO CLIMATE SUMMARY FOR THE YEAR OF 2013...

CLIMATE NORMAL PERIOD 1981 TO 2010
CLIMATE RECORD PERIOD 1872 TO 2013

WEATHER         OBSERVED          NORMAL  DEPART  LAST YEAR`S
                 VALUE   DATE(S)  VALUE   FROM    VALUE  DATE(S)
                                          NORMAL
................................................................
TEMPERATURE (F)
RECORD
 HIGH             105   06/26/2012
                        06/25/2012
                        07/20/2005
 LOW              -29   01/09/1875
HIGHEST           100   07/11        64      36      105  06/26
                        06/11                             06/25
LOWEST            -15   12/05        36     -51       -6  01/11
AVG. MAXIMUM     63.9              64.7    -0.8     68.4
AVG. MINIMUM     36.3              36.3     0.0     39.3
MEAN             50.1              50.5    -0.4     53.9
DAYS MAX >= 90     54              39.6    14.4       73
DAYS MAX <= 32     29              20.0     9.0       19
DAYS MIN <= 32    169             156.9    12.1      132
DAYS MIN <= 0      11               5.8     5.2        4
PRECIPITATION (INCHES)
RECORD
 MAXIMUM        23.31   1196
 MINIMUM         7.29   2008
TOTALS          17.60             14.30    3.30    10.11
DAILY AVG.       0.05              0.04    0.01     0.03
DAYS >= .01        82              79.7     2.3       52
DAYS >= .10        42              34.9     7.1       23
DAYS >= .50         8               7.6     0.4        9
DAYS >= 1.00        3               2.3     0.7        1
GREATEST
 24 HR. TOTAL    2.39   MM                       12/31 TO 12/31
                                                          12/31 TO 12/31
                                                          12/31 TO 12/31
 STORM TOTAL       MM                                 MM
 (MM/DD(HH))            MM                    12/31(00) TO 12/31(00)
                                                 12/31(00) TO 12/31(00)1
                                                 12/31(00) TO 12/31(00)1

SNOWFALL (INCHES)
RECORDS
 TOTAL             MM   5
 24 HR TOTAL       MM
 SNOW DEPTH        MM   MM
TOTALS           74.1              53.8    20.3     38.5
 LIQUID EQUIV    7.41              5.40    2.01     3.85
SINCE 7/1         8.1              22.5   -14.4     12.4
 LIQUID 7/1      0.81              2.20   -1.39     1.24
SNOWDEPTH AVG.      0                MM      MM        0
DAYS >= TRACE      60              33.3    26.7       36
DAYS >= 1.0        20              16.3     3.7       13
GREATEST
 SNOW DEPTH         9   02/25                         11  02/04
 24 HR TOTAL      9.1   MM                       12/31 TO 12/31
                                                          12/31 TO 12/31
                                                          12/31 TO 12/31
 STORM TOTAL       MM                                 MM
 (MM/DD(HH))            MM                    12/31(00) TO 12/31(00)
                                                 12/31(00) TO 12/31(00)1
                                                 12/31(00) TO 12/31(00)1

DEGREE_DAYS
HEATING TOTAL    6302              6059     243     5198
 SINCE 7/1         MM              2468      MM       MM
COOLING TOTAL     999                 0     999     1236
 SINCE 1/1        999               769     230     1236

FREEZE DATES
RECORD
 EARLIEST     09/08/1962
 LATEST       06/08/2007
EARLIEST                        10/07
LATEST                          05/05
..................................................

WIND (MPH)
AVERAGE WIND SPEED              9.7
RESULTANT WIND SPEED/DIRECTION   2/201
HIGHEST WIND SPEED/DIRECTION    64/060    DATE  06/18
HIGHEST GUST SPEED/DIRECTION    97/040    DATE  06/18

SKY COVER
POSSIBLE SUNSHINE (PERCENT)   MM
AVERAGE SKY COVER           0.60
NUMBER OF DAYS FAIR           69
NUMBER OF DAYS PC            232
NUMBER OF DAYS CLOUDY         64

AVERAGE RH (PERCENT)     52

WEATHER CONDITIONS. NUMBER OF DAYS WITH
THUNDERSTORM              0     MIXED PRECIP               0
HEAVY RAIN               14     RAIN                      25
LIGHT RAIN               80     FREEZING RAIN              0
LT FREEZING RAIN          4     HAIL                       0
HEAVY SNOW               11     SNOW                      23
LIGHT SNOW               58     SLEET                      0
FOG                     105     FOG W/VIS <= 1/4 MILE     33
HAZE                     88

-  INDICATES NEGATIVE NUMBERS.
R  INDICATES RECORD WAS SET OR TIED.
MM INDICATES DATA IS MISSING.
T  INDICATES TRACE AMOUNT.
A video screen capture shows Edwin LaMair buried in snow following an avalanche near Vail on Sunday, December 22, 2013. (YouTube / Ed LaMa)
Winter in Colorado brings some of the best ski conditions in the world but in areas outside ski area boundaries, avalanches are a very real danger. One group of skiers was lucky enough to survive an encounter with a collapsing wall of snow Sunday and captured the event on video.
Brothers Edwin and Davis LaMair were skiing near Vail Sunday in two separate groups. With a helmet mounted webcam running, Davis watched in horror as an avalanche on a nearby slope engulfed his brother.
“Holy sh**! That’s Edwin in an avalanche,” Davis exclaimed to his friends.
Our website is constantly changing as new features are added and old ones are updated. Check here to learn what new features have been added lately. If you have a suggestion for a new feature or changes you would like to see, please contact us and let us know!
12/24/13
Not directly weather-related but added live video feeds provided by NASA. Both are available from the Almanac > Astronomy & Space menu on the left.
NASA TV live feed – This is NASA’s television channel providing coverage of what the space agency is doing.
ISS live feed – Live video from the International Space Station. Live video of specific tasks being performed by the astronauts is shown or oftentimes live video from the station’s exterior cameras.
9/14/13
The map on our Northeastern Colorado River Heights and Flood Status page was not working due to changes in the feed from the Advanced Hydrologic Prediction Service. The page has now been updated and incorporates an interactive map. It also displays river heights and flood status for locations across northeastern Colorado. You can find the page in the Almanac menu at the left.
9/11/13
We noticed our Record Weather Event page that is fed from data from the National Weather Service was not working properly. This was due to some changes by the NWS. We have fixed this now and you can always check to see what recent record-breaking weather we have experienced by selecting the Denver / Boulder office from the drop down on the page. The page itself is under the Almanac / National Weather Service menu on the left.
9/1/13
Some much-needed behind the scenes work. The computer that powers all of our weather equipment – the station software, radar, lightning detector, website, etc – was on its last leg. It served us well for 5 years and it was time to go. This weekend we replaced the computer with a brand new one with far more computing power. The upgrade will allow us to continue to bring you the best local weather information and news in Thornton.
8/12/13
Due to changes in the way the U.S. Geological Survey formats its data, we updated our earthquake pages. The new pages now use a Google map to display recent temblors. We also have two earthquake pages now: One for quakes within a 500 mile radius of Denver, and one for all earthquakes globally. You can find the pages in the Almanac menu on the left.
7/14/13
Changes to our Live Weather Gauges page. Gauges are a bit bigger and easier to read, we added a wind rose, the scrolling text display now shows the forecast and at the bottom you can select different units of measure.
6/27/13
We changed our west facing webcam orientation pointing it a bit more vertical. This will allow a better view of the skies above while still maintaining perspective of nearby trees.
9/2/12
We’ve updated our monthly tables for Denver’s “Normals, Means & Extremes” and “”Top 10″ Precipitation & Temp”. You can find them under the Almanac menu on the left then go to Climatology & Records. You can also click here.
Some time ago we added a WeatherNation TV page that allows you to view broadcasts from the network live on our site. Now we have added a National & International Video News page with the latest from NDN’s providers including CBS, AP and many more. It is available under Area Information to the left and then select Video News.
7/3/12
The National Weather Service changed their forecast pages and that necessitated changes of our page as well. While the basics are the same, we took the opportunity to do a bit of an upgrade. The page will automatically display the forecast for Thornton as always but now there is a dropdown menu that allows you to easily grab the forecast from more than a dozen other cities across Colorado. Click here to check it out or select ‘NWS 5 day forecast’ from the Forecasts menu on the left.
6/13/12
We already have a number of ways to view current weather conditions locally and from across the globe – see the Live Conditions menu at the left. One new page we added expands on that and provides conditions from Denver area METAR stations. METARs are permanent weather stations, oftentimes located at airports, that report current conditions in a standardized format (click here for details). Our METAR page reads data from locations like Denver International Airport, Rocky Mountain Metropolitan Airport, Buckley Air Force Base and a number of other locations and provides their reported weather conditions in an easy to view format. You can access it from the Live Conditions menu on the left or by clicking here.
6/12/12
Our Lightning Detection Center pages are among our most popular during severe weather season. We have just added a new page that uses StormVue NGX to display lightning activity. Using Flash, the display gives you the ability to zoom in and out, set alarms, choose what type of strikes to display and much more. You can check it out here or find it in the Lightning menu to the left.
6/10/12
For anyone that reads our news section or views or Facebook page, you are well aware of our fondness for satellite imagery. The ‘eyes in the sky’ can provide an amazing view of weather and disasters. We have added two new pages that allow you to view some of the most amazing imagery:
The NOAA Environmental Visualization Laboratory Image of the Day provides images on a wide variety of topics from weather to climate. We have a new page that allows you to easily view the IOTD. You can find it here or in the Almanac menu to the left.
NASA satellites and spacecraft of course take amazing imagery as well, many of which are curated by the Earth Observatory. We now feature the Natural Hazards and EO Image of the Day on a special page. You can find it here or in the Almanac menu to the left.
Santa Claus begins his whirlwind trip around the globe tonight to deliver toys to all the good little boys and girls! For more than 50 years the North American Aerospace Defense Command (NORAD) has tracked Kris Kringle on Christmas Eve and helped to ensure he completes his journey safely.
ThorntonWeather.com is pleased to be able to provide live Santa tracking from NORAD right here on our site!
For many, the holiday season isn’t complete without a chill in the air and snow on the ground. Here in Denver we historically enjoy a better chance of experiencing the proverbial white Christmas than many places in the nation.
However, how the Mile High City fares in experiencing a white Christmas does depend on your definition of one.
If it means having actual snowfall on Christmas Day the chances aren’t that good. But, if simply having snow on the ground suffices, the chances improve considerably.
Earth is seen by humans in lunar orbit for the first time during Apollo 8. (NASA)
It was Christmas Eve in 1968 when three brave astronauts, the first humans to leave Earth orbit, circled the moon. As the 45th anniversary of that event approaches, NASA has released a video that recreates the iconic Earthrise image that has captivated the world since.
Using imagery obtained from its Lunar Reconnaissance Orbiter, the video released by NASA yesterday allows viewers to see Earthrise as it was first witnessed 45 years ago.
Audio from the Apollo 8 mission provides commentary from the astronauts as they conducted routine observations – until the spacecraft oriented itself to allow them view the planet. The astronauts then scramble to get cameras in place to capture the event.

 Another year is in the books and as we look back at 2013’s weather, we see Thornton – and indeed much of the state – saw cooler and wetter than normal conditions.
 As we begin the new year the winter chill begins to set in. While January can see its share of extremes, the month historically sees stable temperatures and is usually relatively dry.


. NOAA / NCDC")
