High pressure was a recurring theme for the month of September in 2018. This was the driving force behind many days with above normal temperatures and a mere three days with precipitation.
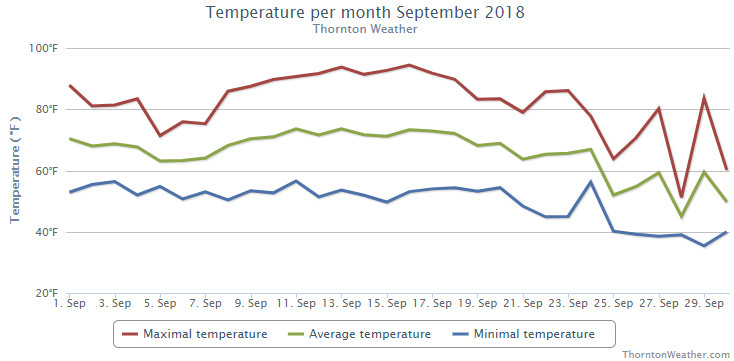
The ridge seemed to show little movement in the month keeping moisture at bay and any cooler air to the north. The middle of the month in particular bore the brunt of this feature when we saw a string of nine days of 90 degree or higher readings.
Thornton’s average temperature for the month came in at 64.8 degrees. Denver’s long term average for the month is 63.4 degrees so we were a good bit above that.
Out at DIA where the Mile High City’s official measurements are kept, it was considerably warmer with an average this year 67.8 degrees. That puts the month in the books as the sixth warmest September on record – with the asterisk that should always comes with Denver’s stats since the station moved to the airport.
Thornton saw its warmest temperature of 94.4 degrees on the 16th of the month and its coldest of 35.3 degrees on the 29th. Denver saw its maximum for the month of 96 degrees on the 13th and its coldest reading of 36 degrees on the 29th.
Officially, Denver saw four records tied or broken. On the 10th the record high of 93 degrees was tied, a 93 degree reading on the 11th broke the record high for the date and a high of 94 degrees on the 14th was tied the record high. Lastly, a record high minimum of 64 degrees was set on the morning of the 13th.
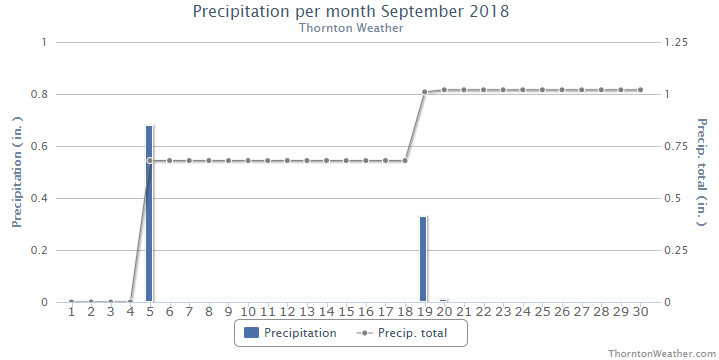
In terms of precipitation, Denver averages 0.96 inches during September. In Thornton, we saw 1.02 inches fall in the bucket with virtually all of that coming on two days. Denver was much drier with only 0.18 inches.
Click here to view Thornton’s September 2018 climate report.
CLIMATE REPORT
NATIONAL WEATHER SERVICE DENVER/BOULDER CO
303 PM MDT MON OCT 1 2018

...................................

...THE DENVER CO CLIMATE SUMMARY FOR THE MONTH OF SEPTEMBER 2018...

CLIMATE NORMAL PERIOD 1981 TO 2010
CLIMATE RECORD PERIOD 1872 TO 2018

WEATHER         OBSERVED          NORMAL  DEPART  LAST YEAR`S
                 VALUE   DATE(S)  VALUE   FROM    VALUE  DATE(S)
                                          NORMAL
................................................................
TEMPERATURE (F)
RECORD
 HIGH              97   09/03/2017
                        09/06/2013
                        09/05/2013
 LOW               17   09/29/1985
HIGHEST            96   09/13        91       5       97  09/03
LOWEST             36   09/29        35       1       40  09/20
                        09/25
AVG. MAXIMUM     82.7              78.5     4.2     79.0
AVG. MINIMUM     52.8              48.3     4.5     51.3
MEAN             67.8              63.4     4.4     65.1
DAYS MAX >= 90      9               3.4     5.6        9
DAYS MAX <= 32      0               0.0     0.0        0
DAYS MIN <= 32      0               0.8    -0.8        0
DAYS MIN <= 0 0 0.0 0.0 0 PRECIPITATION (INCHES) RECORD MAXIMUM 5.61 2013 MINIMUM T 1892 1944 TOTALS 0.18 0.96 -0.78 1.26 DAILY AVG. 0.01 0.03 -0.02 0.04 DAYS >= .01         5               6.5    -1.5        6
DAYS >= .10         0               3.3    -3.3        2
DAYS >= .50         0               0.6    -0.6        1
DAYS >= 1.00        0               0.1    -0.1        0
GREATEST
 24 HR. TOTAL    0.08   09/19

SNOWFALL (INCHES)
 TOTAL            0.0
RECORD
 TOTAL           17.2  1971         1.3

DEGREE_DAYS
HEATING TOTAL      69               125     -56      122
 SINCE 7/1         78               141     -63      130
COOLING TOTAL     160                76      84      131
 SINCE 1/1       1022               764     258      880

FREEZE DATES
RECORD
 EARLIEST     09/08/1962
 LATEST       06/08/2007
EARLIEST                        10/07
LATEST                          05/05
.................................................................

WIND (MPH)
AVERAGE WIND SPEED              9.7
RESULTANT WIND SPEED/DIRECTION   3/170
HIGHEST WIND SPEED/DIRECTION    37/270    DATE  09/19
HIGHEST GUST SPEED/DIRECTION    49/270    DATE  09/19

SKY COVER
AVERAGE SKY COVER           0.40
NUMBER OF DAYS FAIR           13
NUMBER OF DAYS PC             13
NUMBER OF DAYS CLOUDY          4

AVERAGE RH (PERCENT)     43

WEATHER CONDITIONS. NUMBER OF DAYS WITH
THUNDERSTORMS             5   MIXED PRECIP           0
HEAVY RAIN                0   MODERATE RAIN          0
LIGHT RAIN                9   FREEZING RAIN          0
LT FREEZING RAIN          0   HAIL                   0
HEAVY SNOW                0   SNOW                   0
LIGHT SNOW                0   FOG W/VIS <=1/4 MILE   3
FOG                       5   HAZE                   2

-  INDICATES NEGATIVE NUMBERS.
R  INDICATES RECORD WAS SET OR TIED.
MM INDICATES DATA IS MISSING.
T  INDICATES TRACE AMOUNT.