The month was one largely bereft of any true weather drama. It started out quite warm and dry and while we chilled out and got wetter for the second half, there were no significant events of note.
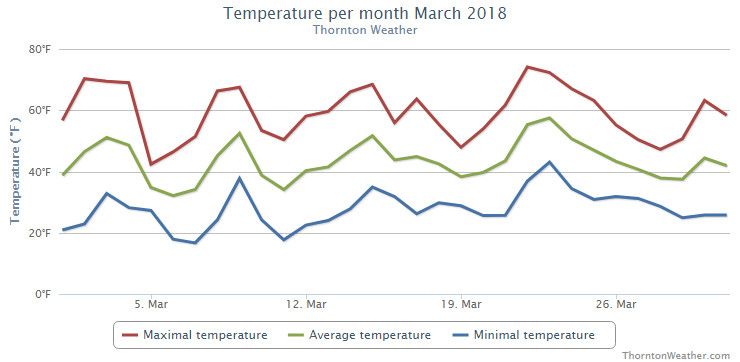
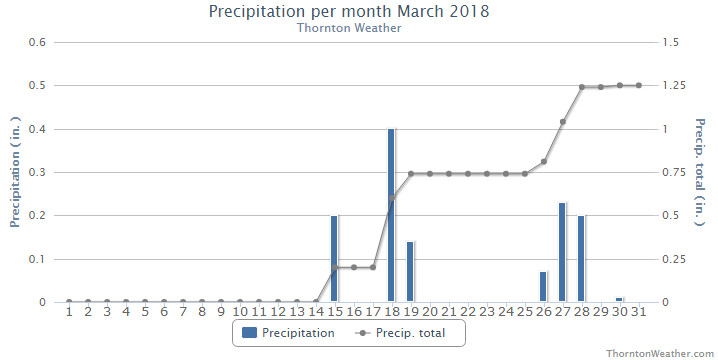
The first couple of weeks of March were notable for their largely warmer than normal temperatures and their lack of precipitation. It wasn’t until the 15th when we finally saw some moisture.
The latter half of the month did turn largely cooler although there was a period from the 21st to the 25th with unseasonably warm mercury readings. Beyond that, things remained cool and we received a few, minor shots of snow and rain.
In the end, the average temperatures for the month were above normal and while snowfall was less than normal, we recorded above average levels of precipitation.
The overall average temperature in Thornton for the month was 42.6 degrees. This was a good bit above Denver’s long term average for the month of 40.4 degrees. In the Mile High City at Denver International Airport where official measurements are kept, a similar average of 42.7 degrees was seen.
Temperatures in Thornton ranged from a maximum of 74.2 degrees on the 22nd down to a low of 16.6 degrees on the 7th. At DIA, the warmest reading was 73 degrees and the coldest 13 degrees, both on the same days as our warmest / coldest readings.
In terms of precipitation, Thornton saw 1.25 inches of liquid precipitation. Denver lagged us with 1.02 inches. Both measurements, however, were above the March long term average of 0.92 inches.
March is usually one of our snowier months with an average of 10.7 inches recorded during the month. We fell a long ways short of that however with Thornton seeing 6.2 inches of the white stuff and Denver only 4.8 inches.
Click here to view Thornton’s March 2018 climate report.
CLIMATE REPORT
NATIONAL WEATHER SERVICE DENVER/BOULDER CO
840 AM MDT SUN APR 1 2018

...................................

...THE DENVER CO CLIMATE SUMMARY FOR THE MONTH OF MARCH 2018...

CLIMATE NORMAL PERIOD 1981 TO 2010
CLIMATE RECORD PERIOD 1872 TO 2018

WEATHER         OBSERVED          NORMAL  DEPART  LAST YEAR`S
                 VALUE   DATE(S)  VALUE   FROM    VALUE  DATE(S)
                                          NORMAL
................................................................
TEMPERATURE (F)
RECORD
 HIGH              84   03/26/1971
 LOW              -11   03/28/1886
HIGHEST            73   03/22        84     -11       81  03/18
LOWEST             13   03/07       -11      24       14  03/01
AVG. MAXIMUM     58.5              54.4     4.1     64.0
AVG. MINIMUM     26.8              26.4     0.4     31.9
MEAN             42.7              40.4     2.3     47.9
DAYS MAX >= 90      0               0.0     0.0        0
DAYS MAX <= 32      0               1.9    -1.9        0
DAYS MIN <= 32     27              23.6     3.4       16
DAYS MIN <= 0       0               0.1    -0.1        0

PRECIPITATION (INCHES)
RECORD
 MAXIMUM         4.56   1983
 MINIMUM         0.03   2012
TOTALS           1.02              0.92    0.10     0.90
DAILY AVG.       0.03              0.03    0.00     0.03
DAYS >= .01         6               5.9     0.1        6
DAYS >= .10         3               2.4     0.6        3
DAYS >= .50         0               0.3    -0.3        0
DAYS >= 1.00        0               0.1    -0.1        0
GREATEST
 24 HR. TOTAL    0.33   03/18 TO 03/18           03/24 TO 03/24


         OBSERVED                 NORMAL  DEPART  LAST YEAR`S

SNOWFALL (INCHES)
TOTALS            4.8              10.7

DEGREE_DAYS
HEATING TOTAL     684               763     -79      523
 SINCE 7/1       4741              5202    -461     4325
COOLING TOTAL       0                 0       0        0
 SINCE 1/1          0                 0       0        0

FREEZE DATES
RECORD
 EARLIEST     09/08/1962
 LATEST       06/08/2007
EARLIEST                        10/07
LATEST                          05/05
.................................................................

WIND (MPH)
AVERAGE WIND SPEED              11.5
RESULTANT WIND SPEED/DIRECTION   2/218
HIGHEST WIND SPEED/DIRECTION    46/280    DATE  03/05
HIGHEST GUST SPEED/DIRECTION    64/290    DATE  03/23

SKY COVER
POSSIBLE SUNSHINE (PERCENT)   MM
AVERAGE SKY COVER           0.50
NUMBER OF DAYS FAIR            8
NUMBER OF DAYS PC             22
NUMBER OF DAYS CLOUDY          1

AVERAGE RH (PERCENT)     46

WEATHER CONDITIONS. NUMBER OF DAYS WITH
THUNDERSTORMS             1   MIXED PRECIP           2
HEAVY RAIN                0   RAIN                   5
LIGHT RAIN                5   FREEZING RAIN          0
LT FREEZING RAIN          0   HAIL                   0
HEAVY SNOW                2   SNOW                   4
LIGHT SNOW                7   FOG W/VIS <=1/4 MILE   2
FOG                       7   HAZE                   1

-  INDICATES NEGATIVE NUMBERS.
R  INDICATES RECORD WAS SET OR TIED.
MM INDICATES DATA IS MISSING.
T  INDICATES TRACE AMOUNT.