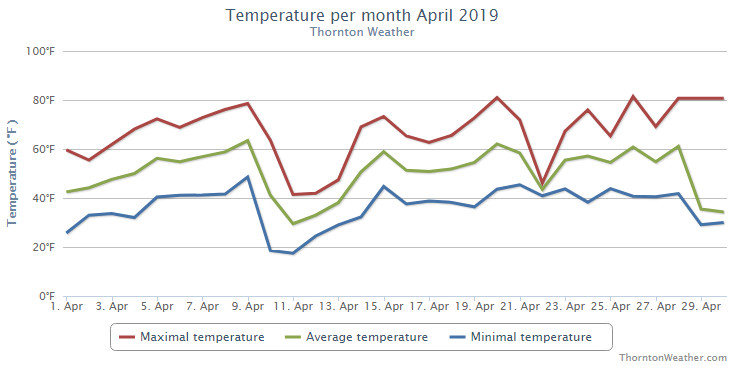
The month of April had the usual, inconsistent weather conditions we expect from the month. Thornton enjoyed everything from spring-like days with mild temperatures to a healthy round of snow and cold.
The month started out mild with seven of the first nine days of the month seeing above normal temperatures and pleasant conditions. A cold front and storm system moved in on the 10th though and brought about significant changes for a few days and our first snow of the month.
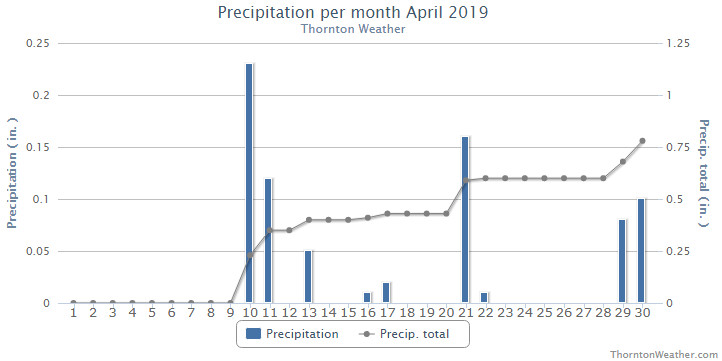
Warmer weather returned though and on the 20th we recorded our first 80 degree day of the year. Showers and thunderstorms on the 21st brought some much-needed rain then we dried back out for the next six days. We saw a couple more 80+ degree days then the final two days chilled things out and delivered a bit more snow.
Thornton’s overall average temperature for the month came in at 49.6 degrees. This was a good bit above Denver’s long-term April average of 47.4 degrees. Out at DIA where the Mile High City’s official measurements are kept, the average temperature was similar with 49.1 degrees.
Temperatures in Thornton ranged from a high of 81.4 degrees on the 26th down to a low of 17.5 degrees on the 11th. Denver saw a high reading of 80 degrees on the 20th and a low of 17 on the 11th.
In terms of precipitation, Denver averages 1.71 inches during April. Both Thornton and Denver fell short of that mark with 0.78 inches and 1.25 inches in their rain buckets respectively.
Snowfall in Thornton was respectable with 8.1 inches of the white stuff. Denver was well short of that with 3.5 inches. April averages 6.8 inches so while Thornton was above that, Denver was below.
Click here to view Thornton’s April 2019 climate report.
CLIMATE REPORT
NATIONAL WEATHER SERVICE DENVER/BOULDER CO
913 AM MDT WED MAY 1 2019

...................................

...THE DENVER CO CLIMATE SUMMARY FOR THE MONTH OF APRIL 2019...

CLIMATE NORMAL PERIOD 1981 TO 2010
CLIMATE RECORD PERIOD 1872 TO 2019

WEATHER         OBSERVED          NORMAL  DEPART  LAST YEAR`S
                 VALUE   DATE(S)  VALUE   FROM    VALUE  DATE(S)
                                          NORMAL
................................................................
TEMPERATURE (F)
RECORD
 HIGH              90   04/30/1992
 LOW               -2   04/02/1975
HIGHEST            80   04/20                         83  04/29
LOWEST             17   04/11                         21  04/06
                        04/10
AVG. MAXIMUM     62.7              61.5     1.2     63.2
AVG. MINIMUM     35.6              33.3     2.3     32.5
MEAN             49.1              47.4     1.7     47.8
DAYS MAX >= 90      0               0.0     0.0        0
DAYS MAX <= 32      0               0.3    -0.3        0
DAYS MIN <= 32     10              13.0    -3.0       16
DAYS MIN <= 0       0               0.0     0.0        0

PRECIPITATION (INCHES)
RECORD
 MAXIMUM         8.24   1900
 MINIMUM         0.03   1963
TOTALS           1.25              1.71   -0.46     0.86
DAILY AVG.       0.04              0.06   -0.02     0.03
DAYS >= .01         9               9.1    -0.1        8
DAYS >= .10         2               4.5    -2.5        4
DAYS >= .50         1               0.9     0.1        0
DAYS >= 1.00        0               0.5    -0.5        0
GREATEST
 24 HR. TOTAL    0.82   04/21 TO 04/21           04/21 TO 04/21

SNOWFALL (INCHES)
RECORDS
 TOTAL            3.5               6.8
RECORD APRIL     33.8    1933

DEGREE_DAYS
HEATING TOTAL     469               529     -60      509
 SINCE 7/1       5805              5731      74     5250
COOLING TOTAL       0                 1      -1        2
 SINCE 1/1          0                 1      -1        2

FREEZE DATES
RECORD
 EARLIEST     09/08/1962
 LATEST       06/08/2007
EARLIEST                        10/07
LATEST                          05/05
.................................................................

WIND (MPH)
AVERAGE WIND SPEED              10.3
RESULTANT WIND SPEED/DIRECTION   0/078
HIGHEST WIND SPEED/DIRECTION    44/310    DATE  04/21
HIGHEST GUST SPEED/DIRECTION    55/280    DATE  04/28

SKY COVER
POSSIBLE SUNSHINE (PERCENT)   MM
AVERAGE SKY COVER           0.60
NUMBER OF DAYS FAIR            2
NUMBER OF DAYS PC             19
NUMBER OF DAYS CLOUDY          9

AVERAGE RH (PERCENT)     56

-  INDICATES NEGATIVE NUMBERS.
R  INDICATES RECORD WAS SET OR TIED.
MM INDICATES DATA IS MISSING.
T  INDICATES TRACE AMOUNT.