2014 has come to a close and as we look back on the year, we can see that it was a relatively average year lacking too much drama.
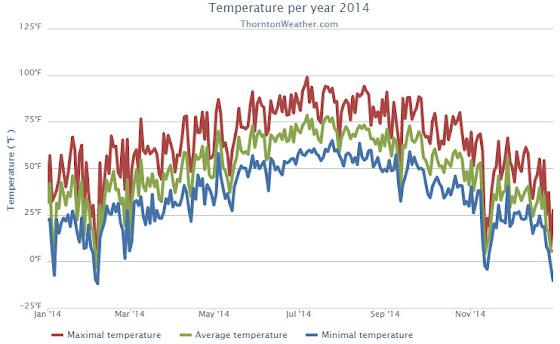
In terms of temperatures, Thornton saw an average overall annual temperature of 49.4 degrees. Out at Denver International Airport where the Mile High City’s official records are kept, the average was warmer at 50.5 degrees. By comparison, Denver’s 1981 to 2010 annual average temperature is 50.4 degrees.
Thornton recorded 29 days of high temperature readings at or above 90 degrees. On average Denver sees 40 of them. Denver matched our number with 29 as well.
The hottest reading of the year was 98.2 degrees which came on July 7. Denver’s highest reading of 100 degrees came on the same date.
At the other end of the spectrum, our coldest temperature was -12.6 degrees on February 5th. Denver bested us with two -19 degree readings, one on February 5th and another on December 30th.
In all, Thornton saw 155 days with readings below freezing. Denver recorded 150. Both were near the average of 156.9 days.
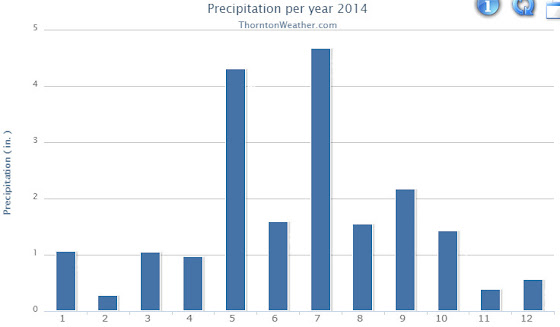
Precipitation for 2014 came in a good ways above average, largely due to a wet May and July. Thornton took 19.54 inches into the rain bucket while Denver received slightly less with 18.77 inches. Both were well above the annual average of 14.30 inches.
Snowfall for the calendar year lagged behind average in both Thornton and Denver. Thornton saw 46.2 inches of the white stuff, Denver a nearly identical 46.3 inches. On average we expect to see 53.8 inches.
Click here to view Thornton’s 2014 climate summary report.
From the National Weather Service:
CLIMATE REPORT
NATIONAL WEATHER SERVICE BOULDER, CO
200 AM MST THU JAN 1 2015

...................................

...THE DENVER CO CLIMATE SUMMARY FOR THE YEAR OF 2014...

CLIMATE NORMAL PERIOD 1981 TO 2010
CLIMATE RECORD PERIOD 1872 TO 2014

WEATHER         OBSERVED          NORMAL  DEPART  LAST YEAR`S
                 VALUE   DATE(S)  VALUE   FROM    VALUE  DATE(S)
                                          NORMAL
................................................................
TEMPERATURE (F)
RECORD
 HIGH             105   06/26/2012
                        06/25/2012
                        07/20/2005
                        08/08/1878
 LOW              -29   01/09/1875
HIGHEST           100   07/07        64      36      100  07/11
                                                          06/11
LOWEST            -19   12/30        36     -55      -15  12/05
                        02/05
AVG. MAXIMUM     64.6              64.7    -0.1     63.9
AVG. MINIMUM     36.5              36.3     0.2     36.3
MEAN             50.5              50.5     0.0     50.1
DAYS MAX >= 90     29              39.6   -10.6       54
DAYS MAX <= 32     24              20.0     4.0       29
DAYS MIN <= 32    150             156.9    -6.9      169
DAYS MIN <= 0      14               5.8     8.2       11

PRECIPITATION (INCHES)
RECORD
 MAXIMUM        23.31   1967
 MINIMUM         7.29   2008
TOTALS          18.77             14.30    4.47    17.60
DAILY AVG.       0.05              0.03    0.02     0.05
DAYS >= .01        98              79.7    18.3       82
DAYS >= .10        44              34.9     9.1       42
DAYS >= .50        10               7.6     2.4        8
DAYS >= 1.00        4               2.3     1.7        3
GREATEST
 24 HR. TOTAL    2.85   07/29 TO 07/30             09/13 TO 09/14

 STORM TOTAL       2.93                             4.65
 (MM/DD(HH))      07/29(00) TO 07/30(00)   09/09(00) TO 09/15(00)

SNOWFALL (INCHES)
RECORDS
 TOTAL          115.9   1913
                        0
                        0
 24 HR TOTAL     23.6   12/24/1982 TO 12/24/1982
 SNOW DEPTH        MM   MM
TOTALS           46.3              53.8    -7.5     72.1
 LIQUID EQUIV     MM                MM      MM       MM
SINCE 7/1        16.0              22.5    -6.5      8.1
 LIQUID 7/1       MM                MM      MM       MM
SNOWDEPTH AVG.      0                MM      MM        0
DAYS >= TRACE      55              33.3    21.7       60
DAYS >= 1.0        17              16.3     0.7       20
GREATEST
 SNOW DEPTH         6   12/31                          9  02/25
                        12/30
 24 HR TOTAL      5.4   12/29                    02/24 TO 02/24

 STORM TOTAL      5.9                               11.7
 (MM/DD(HH))      12/29(00) 12/30(00)        03/22(00) TO 03/24(00)

DEGREE_DAYS
HEATING TOTAL    5844              6059    -215     6302
 SINCE 7/1       2291              2468    -207     2451
COOLING TOTAL     701               769     -68      999
 SINCE 1/1        701               769     -68      999

FREEZE DATES
RECORD
 EARLIEST     09/08/1962
 LATEST       06/08/2007
EARLIEST                        10/07
LATEST                          05/05
.....................................................

WIND (MPH)
AVERAGE WIND SPEED              10.2
RESULTANT WIND SPEED/DIRECTION   2/214
HIGHEST WIND SPEED/DIRECTION    51/310    DATE  07/11
HIGHEST GUST SPEED/DIRECTION    66/340    DATE  04/29

SKY COVER
POSSIBLE SUNSHINE (PERCENT)   MM
AVERAGE SKY COVER           0.60
NUMBER OF DAYS FAIR           72
NUMBER OF DAYS PC            226
NUMBER OF DAYS CLOUDY         67

AVERAGE RH (PERCENT)     54

WEATHER CONDITIONS. NUMBER OF DAYS WITH
THUNDERSTORM              0     MIXED PRECIP               1
HEAVY RAIN               15     RAIN                      35
LIGHT RAIN               91     FREEZING RAIN              0
LT FREEZING RAIN          2     HAIL                       6
HEAVY SNOW                6     SNOW                      24
LIGHT SNOW               56     SLEET                      1
FOG                     115     FOG W/VIS <= 1/4 MILE     32
HAZE                     57

-  INDICATES NEGATIVE NUMBERS.
R  INDICATES RECORD WAS SET OR TIED.
MM INDICATES DATA IS MISSING.
T  INDICATES TRACE AMOUNT.