The biannual ritual of changing our clocks to adjust for Daylight Savings Time occurs this Saturday night providing yet another signal of the changing of seasons. The United States will ‘spring forward’ one hour at 2:00am Sunday morning as we begin Daylight Savings Time.
The ritual of changing our clocks twice a year can be met with some resistance as some people struggle to adjust their body’s internal clock. The start of Daylight Savings Time can be particularly problematic given the one hour less sleep people receive on the night of the change.
However, longer days as we head into the milder months are a very real benefit and for many worth the inconvenience of a lost hour of sleep. The time change definitely has big effects on how much daylight we enjoy during our normal waking hours.
On Saturday, prior to the change, sunset will occur at 6:04pm but on Sunday the sun won’t disappear over the horizon until 7:05pm. This affords folks more time in the evening to get started on those spring-time chores and allows us to get outside and enjoy the warming weather.
The March Equinox is also on the horizon. Spring officially begins at 10:30pm on March 19.
This year Daylight Savings Time will come to an end on November 6.
Some of the recent history of Daylight Savings Time (from Wikipedia):
Daylight saving time in the United States was first observed in 1918. Most areas of the United States currently observe daylight saving time, with the exceptions being the states of Arizona and Hawaii along with the territories of Puerto Rico, American Samoa, Guam, and the Northern Mariana Islands.
From 1987 to 2006, daylight saving time in the United States began on the first Sunday of April and ended on the last Sunday of October. The time was adjusted at 2:00 AM (0200) local time (as it still is done now).
Since 2007, daylight saving time starts on the second Sunday of March and ends on the first Sunday of November, with all time changes taking place at 2:00 AM (0200) local time. In 2011, daylight saving time began on March 13 and will end on November 6.
Daylight Savings Time Schedule
| Year | DST Begins 2 a.m. (Second Sunday in March) |
DST Ends 2 a.m. (First Sunday in November) |
|---|---|---|
| 2016 | 13 March 2016 | 6 November 2016 |
| 2017 | 12 March 2017 | 5 November 2017 |
| 2018 | 11 March 2018 | 4 November 2018 |
| 2019 | 10 March 2019 | 3 November 2019 |
| 2020 | 8 March 2020 | 1 November 2020 |
| 2021 | 14 March 2021 | 7 November 2021 |
| 2022 | 13 March 2022 | 6 November 2022 |

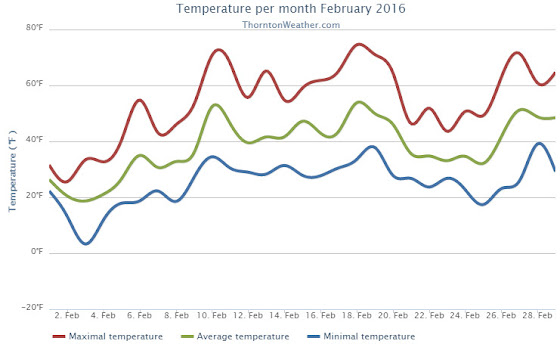
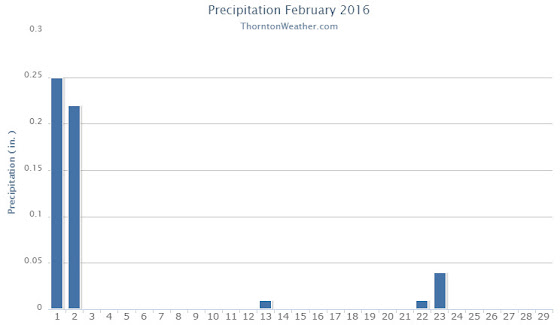

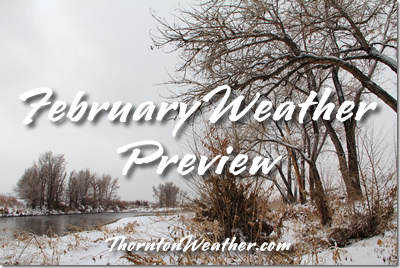 February in Colorado typically brings to an end an extended period when average temperatures are at their lowest. Winter begins to loosen its grip and temperatures get warmer but precipitation is not a particularly common event during the month.

 A significant winter storm is bearing down on Colorado and the state is blanketed with watches and warnings. The system has the potential to deliver our biggest snowfall of the 2015 / 2016 season thus far.