Extreme weather can occur during in month in Colorado we well know. June however is when traditional spring severe weather arrives in the state oftentimes with hail, damaging wind and tornadoes.
Over 40 percent of the tornadoes that occur in Colorado happen during the month of June. Far more common are thunderstorms with hail and wind, each responsible for extensive damage each year.
While severe weather is common, so too are brilliantly sunny and mild days as we close out spring and enter summer. If you are looking for cold, it isn’t likely but it is possible as the Denver area has seen freezing temperatures and yes, even snow, during the month.
Thornton saw overall weather conditions not too far out of line with what we expect for the month of May. Temperatures were a good bit below normal however while precipitation came in right near average.
The month started out a bit chilly and we received our first and only snow for the month on the first. Warmer weather returned right away though and lasted until the 7th of the month when severe weather arrived to the Colorado plains. Tornadoes and large hail were seen to our east and northeast but we received only a bit of rain and some small hail.
Cooler weather conditions lasted for a few days before we warmed up for two days on the 12th and 13th. That was short-lived however and once again things cooled down quite a bit with the 16th and 17th of the month seeing high temperatures only in the mid to upper 40s and a healthy shot of rain.
The final 11 days of the month saw temperatures near or above normal for the most part. Stormy weather returned on the 24th as afternoon thunderstorms brought marble sized hail to Thornton. Eastern Adams County and Washington County saw tornadoes and large, damaging hail. Six of those last 11 days of the month did bring measurable precipitation.
Thornton saw a monthly average temperature of 54.2 degrees. This was well below Denver’s 30 year average for the month of May of 57.1 degrees. Out at DIA where Denver’s official measurements are taken, the Mile High City was similarly cool with a monthly average of 54.4 degrees.
Temperatures in Thornton ranged from a high of 85.6 degrees on the 21st down to a below freezing low of 24.9 degrees on the 2nd. Out at the airport, the warmest reading was 83 degrees and the lowest 28 degrees, both on the same dates as our warmest / coldest temperatures.
In terms of precipitation, Denver averages 2.12 inches during the month of May. Thornton saw 2.07 inches in our rain bucket while DIA recorded 2.38 inches.
The only snow during May 2016 in Thornton came on the first of the month when 0.3 inches fell. Denver officially recorded only a trace. Average snowfall for the month of May in Denver is 1.1 inches.
May 2016 temperature summary for Thornton, Colorado. (ThorntonWeather.com)May 2016 precipitation summary for Thornton, Colorado. (ThorntonWeather.com)
From the National Weather Service:
CLIMATE REPORT
NATIONAL WEATHER SERVICE DENVER/BOULDER CO
244 AM MDT WED JUN 1 2016

...THE DENVER CO CLIMATE SUMMARY FOR THE MONTH OF MAY 2016...

CLIMATE NORMAL PERIOD 1981 TO 2010
CLIMATE RECORD PERIOD 1872 TO 2016

WEATHER         OBSERVED          NORMAL  DEPART  LAST YEAR`S
                 VALUE   DATE(S)  VALUE   FROM    VALUE  DATE(S)
                                          NORMAL
................................................................
TEMPERATURE (F)
RECORD
 HIGH              95   05/26/1942
 LOW               19   05/02/2013
                        05/03/1907
                        01/01/2000
HIGHEST            83   05/21        95     -12       85  05/31
LOWEST             28   05/02        19       9       27  05/10
                                                          05/09
AVG. MAXIMUM     66.9              71.5    -4.6     63.3
AVG. MINIMUM     41.9              42.7    -0.8     42.7
MEAN             54.4              57.1    -2.7     53.0
DAYS MAX >= 90      0               0.8    -0.8        0
DAYS MAX <= 32      0               0.0     0.0        0
DAYS MIN <= 32      3               1.9     1.1        3
DAYS MIN <= 0       0               0.0     0.0        0

PRECIPITATION (INCHES)
RECORD
 MAXIMUM         8.57   1876
 MINIMUM         0.06   1974
TOTALS           2.38              2.12    0.26     3.76
DAILY AVG.       0.08              0.07    0.01     0.12
DAYS >= .01        13               9.4     3.6       19
DAYS >= .10         4               4.8    -0.8       10
DAYS >= .50         1               1.2    -0.2        2
DAYS >= 1.00        1               0.2     0.8        1
GREATEST
 24 HR. TOTAL    1.38   05/26 TO 05/27           05/08 TO 05/09
                                                          05/09 TO 05/09
SNOWFALL (INCHES)
RECORDS
 TOTAL             MM   MM
TOTALS              T               1.1

DEGREE_DAYS
HEATING TOTAL     326               265      61      367
 SINCE 7/1       5556              5996    -440     5572
COOLING TOTAL       3                21     -18        4
 SINCE 1/1          3                22     -19        4

FREEZE DATES
RECORD
 EARLIEST     09/08/1962
 LATEST       06/08/2007
EARLIEST                        10/07
LATEST                          05/05
..........................................................

WIND (MPH)
AVERAGE WIND SPEED              10.2
RESULTANT WIND SPEED/DIRECTION   2/154
HIGHEST WIND SPEED/DIRECTION    39/200    DATE  05/08
HIGHEST GUST SPEED/DIRECTION    47/300    DATE  05/29

SKY COVER
POSSIBLE SUNSHINE (PERCENT)   MM
AVERAGE SKY COVER           0.60
NUMBER OF DAYS FAIR            4
NUMBER OF DAYS PC             18
NUMBER OF DAYS CLOUDY          9

AVERAGE RH (PERCENT)     60

WEATHER CONDITIONS. NUMBER OF DAYS WITH
THUNDERSTORM             13     MIXED PRECIP               0
HEAVY RAIN                1     RAIN                       5
LIGHT RAIN               17     FREEZING RAIN              0
LT FREEZING RAIN          0     HAIL                       2
HEAVY SNOW                0     SNOW                       1
LIGHT SNOW                1     SLEET                      0
FOG                      10     FOG W/VIS <= 1/4 MILE      2
HAZE                      3

-  INDICATES NEGATIVE NUMBERS.
R  INDICATES RECORD WAS SET OR TIED.
MM INDICATES DATA IS MISSING.
T  INDICATES TRACE AMOUNT.
Colorado’s famously highly variable weather seems to showcase itself during the month of May when a variety of weather conditions can be seen.
Winter-like temperatures and snow are possible as are mid-summer like temperatures or the more typical spring severe weather.
As the month starts out in 2016 we see snow but then warmer, milder weather is expected to arrive for the balance of the first week of the month. Long range forecasts lean toward overall cooler and wetter than normal conditions.
However the month can bring extremes. Snow is not entirely uncommon during the month, oftentimes causing damage to newly bloomed trees. More common however is severe weather, particularly in the latter half of the month. Thunderstorms become more frequent and their associated hazards – lightning, wind, hail and tornadoes – are usual visitors.
Coming off a very snowy and cold March, Thornton saw a relatively seasonal April 2016. Temperatures were right near normal but we did see a healthier than average dose of snow and precipitation.
The month started out quite mild. In fact 13 of the first 14 days saw above average high temperatures. That changed quickly though at the middle of the month when a storm system brought cold and snow to the Front Range. While most of the white stuff fell to our south, Thornton managed respectable totals over the 16th and 17th of the month.
We then returned to mild weather but only for a few days as a series of low pressure systems passed through the state. The final three days of the month saw well-below average high temperatures and periods of rain and snow.
Thornton saw an average temperature for the month of 48.0 degrees. Out at the airport where Denver’s official measurements are kept, the monthly average was a bit cooler at 47.2 degrees. Both were quite close to the April long term average of 47.4 degrees.
Temperatures in Thornton ranged from a maximum of 78.3 degrees on the 22nd down to a low of 21.9 degrees on the first of the month. DIA saw a maximum of 77 degrees on the 22nd and 23rd and a low of 25 degrees on the first.
In terms of precipitation, Denver’s long term April average is 1.71 inches. On this front, both Thornton and Denver came out above normal. We saw 2.47 inches of liquid precipitation in our bucket in Thornton while Denver recorded 2.56 inches.
Snowfall was above the 8.9 inch April average in Thornton and Denver. Thornton however only bested it by a half inch with a total of 9.4 inches for the month. Out at the airport, 15.6 inches was recorded.
Thornton, Colorado’s April 2016 temperature summary. (ThorntonWeather.com)Thornton, Colorado’s April 2016 precipitation summary. (ThorntonWeather.com)
CLIMATE REPORT
NATIONAL WEATHER SERVICE DENVER/BOULDER CO
244 AM MDT SUN MAY 1 2016

...THE DENVER CO CLIMATE SUMMARY FOR THE MONTH OF APRIL 2016...

CLIMATE NORMAL PERIOD 1981 TO 2010
CLIMATE RECORD PERIOD 1872 TO 2016

WEATHER         OBSERVED          NORMAL  DEPART  LAST YEAR`S
                 VALUE   DATE(S)  VALUE   FROM    VALUE  DATE(S)
                                          NORMAL
................................................................
TEMPERATURE (F)
RECORD
 HIGH              90   04/30/1992
 LOW               -2   04/02/1975
HIGHEST            77   04/23        90     -13       79  04/30
                        04/22
                        04/14
LOWEST             25   04/01        -2      27       27  04/03
AVG. MAXIMUM     59.4              61.5    -2.1     62.1
AVG. MINIMUM     35.1              33.3     1.8     35.3
MEAN             47.2              47.4    -0.2     48.7
DAYS MAX >= 90      0               0.0     0.0        0
DAYS MAX <= 32      0               0.3    -0.3        0
DAYS MIN <= 32     11              13.0    -2.0        7
DAYS MIN <= 0 0 0.0 0.0 0 PRECIPITATION (INCHES) RECORD MAXIMUM 8.24 1900 MINIMUM 0.03 1963 TOTALS 2.56 1.71 0.85 2.65 DAILY AVG. 0.09 0.06 0.03 0.09 DAYS >= .01        10               9.1     0.9        9
DAYS >= .10         6               4.5     1.5        6
DAYS >= .50         2               0.9     1.1        2
DAYS >= 1.00        1               0.5     0.5        1
GREATEST
 24 HR. TOTAL    1.22   04/15 TO 04/16           04/16 TO 04/17
                                                          04/17 TO 04/17
                                                          04/17 TO 04/17
 STORM TOTAL       MM                                 MM
 (MM/DD(HH))            MM                    04/17(00) TO 04/17(00)
                                                 04/17(00) TO 04/17(00)7
                                                 04/17(00) TO 04/17(00)7

SNOWFALL (INCHES)
TOTALS           15.6               8.9    6.7

DEGREE_DAYS
HEATING TOTAL     526               529      -3      481
 SINCE 7/1       5230              5731    -501     5205
COOLING TOTAL       0                 1      -1        0
 SINCE 1/1          0                 1      -1        0

FREEZE DATES
RECORD
 EARLIEST     09/08/1962
 LATEST       06/08/2007
EARLIEST      04/01             10/07
LATEST                          05/05
........................................................

WIND (MPH)
AVERAGE WIND SPEED              10.9
RESULTANT WIND SPEED/DIRECTION   2/243
HIGHEST WIND SPEED/DIRECTION    43/300    DATE  04/05
HIGHEST GUST SPEED/DIRECTION    53/300    DATE  04/05

SKY COVER
POSSIBLE SUNSHINE (PERCENT)   MM
AVERAGE SKY COVER           0.60
NUMBER OF DAYS FAIR            6
NUMBER OF DAYS PC             15
NUMBER OF DAYS CLOUDY          9

AVERAGE RH (PERCENT)     55

WEATHER CONDITIONS. NUMBER OF DAYS WITH
THUNDERSTORM              0     MIXED PRECIP               0
HEAVY RAIN                0     RAIN                       2
LIGHT RAIN                6     FREEZING RAIN              0
LT FREEZING RAIN          0     HAIL                       0
HEAVY SNOW                1     SNOW                       5
LIGHT SNOW                8     SLEET                      0
FOG                       9     FOG W/VIS <= 1/4 MILE      4
HAZE                      1

-  INDICATES NEGATIVE NUMBERS.
R  INDICATES RECORD WAS SET OR TIED.
MM INDICATES DATA IS MISSING.
T  INDICATES TRACE AMOUNT.
Carol Rasmussen, NASA Using satellite data on how water moves around Earth, NASA scientists have solved two mysteries about wobbles in the planet’s rotation – one new and one more than a century old. The research may help improve our knowledge of past and future climate. Although a desktop globe always spins smoothly around the axis… Continue reading Two Mysteries About Wobbling Earth Have Been Solved→
The month of March 2016 in Thornton was a bit of a tale of two halves. The first, mild and dry. The second, colder and much, much wetter.
We started out with above normal temperature readings dominating the daily temperatures. In fact 12 of the first 14 days of the month saw high temperatures above average, some well above. Other than a nice bit of rain on the 7th, those first two weeks were dry as well. All were courtesy of strong high pressure staying over the region.
Things cooled down briefly for the next few days and we received a nice bit of snow on the 17th and 18th. However, warm weather returned with back to back 70+ degree days on the 21st and 22nd.
March is however our snowiest month and Mother Nature delivered a walloping reminder of that on the 23rd. Blizzard conditions arrived early in the morning and persisted through the day. Schools and businesses shuttered as did the airport and major interstates.
Cool, unsettled weather conditions finished out the month. Another, light show of snow came on the 26th followed by flurries on the 31st.
Thornton’s overall average temperature for March was 41.4 degrees. This was very close to Denver’s official measurement of 41.6 degrees as taken out at DIA. The average monthly temperature for March is 40.4 degrees.
Thornton saw a maximum mercury reading of 72.4 degrees on the 21st and a low of 13.5 degrees on the 24th. Out at the airport, Denver saw its highest reading of 74 degrees on the 11th and a low of 10 degrees on the 24th.
In terms of precipitation, rain and snow combined to bring Thornton a wet 3.21 inches. The long term average for Denver in March is 0.92 inches.
Denver’s automated system claims a mere 0.90 inches of liquid precipitation at the airport. It is clear that they had a very incorrect reading from the blizzard on the 23rd. Their climate report for the month makes the note, “the precipitation for March 23rd is too low due to undercatch from blizzard. This value is under review. This could change the values below.”
Snowfall was abundant for the month and far exceeded the average of 10.7 inches for Denver. Here in Thornton we received 30.1 inches – our second highest monthly total in 10 years. The airport lagged considerably due to their location out in the middle of nowhere with 18.4 inches.
Thornton, Colorado’s March 2016 temperature summary. (ThorntonWeather.com)Thornton, Colorado’s March 2016 precipitation summary. (ThorntonWeather.com)
From the National Weather Service:
CLIMATE REPORT
NATIONAL WEATHER SERVICE DENVER/BOULDER CO
1255 PM MDT FRI APR 1 2016

...................................

...THE DENVER CO CLIMATE SUMMARY FOR THE MONTH OF MARCH 2016...

CLIMATE NORMAL PERIOD 1981 TO 2010
CLIMATE RECORD PERIOD 1872 TO 2016

WEATHER         OBSERVED          NORMAL  DEPART  LAST YEAR`S
                 VALUE   DATE(S)  VALUE   FROM    VALUE  DATE(S)
                                          NORMAL
................................................................
TEMPERATURE (F)
RECORD
 HIGH              84   03/26/1971
 LOW              -11   03/28/1886
HIGHEST            74   03/11        73       1       81  03/16
LOWEST             10   03/24        11      -1        2  03/05
AVG. MAXIMUM     54.9              54.4     0.5     58.9
AVG. MINIMUM     28.3              26.4     1.9     31.2
MEAN             41.6              40.4     1.2     45.0
DAYS MAX >= 90      0               0.0     0.0        0
DAYS MAX <= 32      1               1.9    -0.9        2
DAYS MIN <= 32     21              23.6    -2.6       12
DAYS MIN <= 0 0 0.1 -0.1 0

PRECIPITATION (INCHES)
RECORD
 MAXIMUM 4.56 1983
 MINIMUM 0.03 2012

*THE PRECIPITATION FOR MARCH 23RD IS TOO LOW DUE TO UNDERCATCH
FROM BLIZZARD. THIS VALUE IS UNDER REVIEW. THIS COULD CHANGE
THE VALUES BELOW.

TOTALS 0.90* 0.92 -0.02* 0.79
DAILY AVG. 0.03* 0.03 0.00* 0.03
DAYS >= .01         9               5.9     3.1        5
DAYS >= .10         2               2.4    -0.4        3
DAYS >= .50         0               0.3    -0.3        0
DAYS >= 1.00        0*              0.1    -0.1*       0
GREATEST
 24 HR. TOTAL    0.49*  03/23 TO 03/23           03/19 TO 03/19

SNOWFALL (INCHES)
RECORDS
 TOTAL           18.4              10.7
RECORD MARCH     35.2                         2003

DEGREE_DAYS
HEATING TOTAL     716               763     -47      611
 SINCE 7/1       4704              5202    -498     4724
COOLING TOTAL       0                 0       0        0
 SINCE 1/1          0                 0       0        0

FREEZE DATES
RECORD
 EARLIEST     09/08/1962
 LATEST       06/08/2007
EARLIEST                        10/07
LATEST                          05/05
..........................................................

WIND (MPH)
AVERAGE WIND SPEED              11.7
RESULTANT WIND SPEED/DIRECTION   3/238
HIGHEST WIND SPEED/DIRECTION    53/340    DATE  03/23
HIGHEST GUST SPEED/DIRECTION    59/340    DATE  03/23

SKY COVER
POSSIBLE SUNSHINE (PERCENT)   MM
AVERAGE SKY COVER           0.60
NUMBER OF DAYS FAIR            3
NUMBER OF DAYS PC             20
NUMBER OF DAYS CLOUDY          8

AVERAGE RH (PERCENT)     48

WEATHER CONDITIONS. NUMBER OF DAYS WITH
THUNDERSTORM              1     MIXED PRECIP               0
HEAVY RAIN                0     RAIN                       0
LIGHT RAIN                4     FREEZING RAIN              0
LT FREEZING RAIN          0     HAIL                       1
HEAVY SNOW                1     SNOW                       4
LIGHT SNOW                8     SLEET                      0
FOG                      11     FOG W/VIS <= 1/4 MILE      2
HAZE                      3

-  INDICATES NEGATIVE NUMBERS.
R  INDICATES RECORD WAS SET OR TIED.
MM INDICATES DATA IS MISSING.
T  INDICATES TRACE AMOUNT.
The month of February was a bit of a mixed bag of weather conditions for Thornton. While it started out cold and snowy, it finished quite warm.
Snow and cold were the main features for the month initially as we received our biggest snowfall of the season on the 1st and 2nd. Thornton recorded a healthy 11.1 inches from the system while Denver officially saw 11.6 inches.
The white stuff and the cold with it did not last long however. Cold did linger for a few days but an extended period from the 9th to the 20th saw dry conditions and warmer than normal temperatures.
A very brief interlude then arrived cooling things down and delivering light snow on the 23rd. From there, the warm and dry conditions returned and closed out the month.
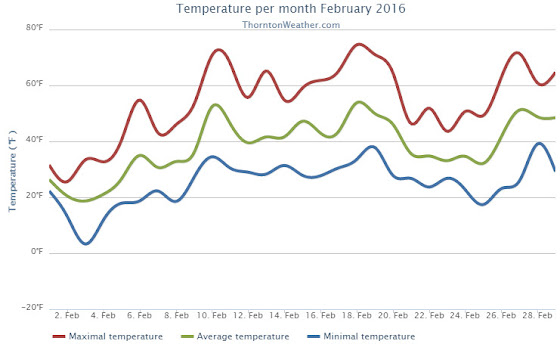
Thornton saw an average monthly temperature of 38.5 degrees for the month. Out at the airport where Denver’s official measurements are taken, the month averaged 37.8 degrees. Both were well above the historical February average of 32.5 degrees.
Temperatures in Thornton ranged from a high of 74.5 degrees on the 18th down to a low of 3.3 degrees on the morning of the 3rd. Denver’s maximum reading for the month was 73 degrees and its lowest 1 degree, both occurring on the same day as Thornton’s. The Mile High City’s reading on the 18th was a record high for the date.
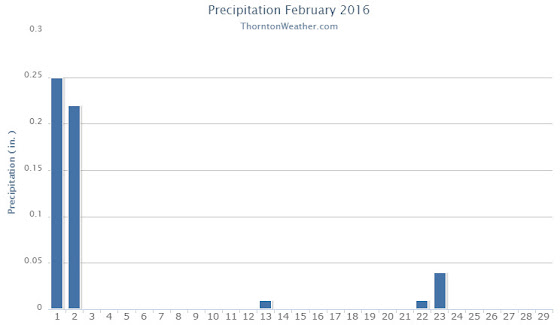
In terms of precipitation, Denver averages 0.37 inches during what is usually a relatively dry month. Thornton saw 0.53 inches of liquid precip while DIA recorded 0.48 inches. For both locations, the bulk of the moisture occurred with the snowstorm that started the month.
Snowfall was well above normal for February 2016. Thornton saw 11.9 inches and Denver 11.6 inches. Average for February is 5.9 inches.
Thornton, Colorado’s February 2016 Temperature Summary. (ThorntonWeather.com)Thornton, Colorado’s February 2016 Precipitation Summary. (ThorntonWeather.com)
From the National Weather Service:
CLIMATE REPORT
NATIONAL WEATHER SERVICE DENVER/BOULDER CO
1035 AM MST TUE MAR 1 2016

...................................

...THE DENVER CO CLIMATE SUMMARY FOR THE MONTH OF FEBRUARY 2016...

CLIMATE NORMAL PERIOD 1981 TO 2010
CLIMATE RECORD PERIOD 1872 TO 2016

WEATHER         OBSERVED          NORMAL  DEPART  LAST YEAR`S
                 VALUE   DATE(S)  VALUE   FROM    VALUE  DATE(S)
                                          NORMAL
................................................................
TEMPERATURE (F)
RECORD
 HIGH              77   02/28/2006
                        02/04/1890
 LOW              -25   02/01/1951
                        02/08/1936
HIGHEST            73   02/18        68       5       74  02/07
LOWEST              1   02/03         5       4       -6  02/27
AVG. MAXIMUM     52.2              46.2     6.0     46.6
AVG. MINIMUM     23.4              18.9     4.5     21.0
MEAN             37.8              32.5     5.3     33.8
DAYS MAX >= 90      0               0.0     0.0        0
DAYS MAX <= 32      3               3.9    -0.9        7
DAYS MIN <= 32     25              26.9    -1.9       24
DAYS MIN <= 0       0               1.3    -1.3        2

PRECIPITATION (INCHES)
RECORD
 MAXIMUM         2.01   1934
 MINIMUM         0.01   1970
TOTALS           0.48              0.37    0.11     1.25
DAILY AVG.       0.02                MM      MM     0.04
DAYS >= .01         2               5.3    -3.3       10
DAYS >= .10         2               0.7     1.3        5
DAYS >= .50         0               0.0     0.0        0
DAYS >= 1.00        0               0.0     0.0        0
GREATEST
 24 HR. TOTAL    0.45   02/01 TO 02/02                    02/15 TO 02/16
                                                          02/21 TO 02/21

SNOWFALL (INCHES)
RECORDS
 TOTAL           11.6               5.7
RECORD FEBRUARY  22.4                            2015

DEGREE_DAYS
HEATING TOTAL     780               908    -128      864
 SINCE 7/1       3988              4468    -480     4113
COOLING TOTAL       0                 0       0        0
 SINCE 1/1          0                 0       0        0

FREEZE DATES
RECORD
 EARLIEST     09/08/1962
 LATEST       06/08/2007
EARLIEST                        10/07
LATEST                          05/05
..................................................

WIND (MPH)
AVERAGE WIND SPEED              11.3
RESULTANT WIND SPEED/DIRECTION   3/217
HIGHEST WIND SPEED/DIRECTION    43/220    DATE  02/18
HIGHEST GUST SPEED/DIRECTION    53/230    DATE  02/18

SKY COVER
POSSIBLE SUNSHINE (PERCENT)   MM
AVERAGE SKY COVER           0.50
NUMBER OF DAYS FAIR            8
NUMBER OF DAYS PC             18
NUMBER OF DAYS CLOUDY          3

AVERAGE RH (PERCENT)     50

WEATHER CONDITIONS. NUMBER OF DAYS WITH
THUNDERSTORM              0     MIXED PRECIP               0
HEAVY RAIN                0     RAIN                       0
LIGHT RAIN                0     FREEZING RAIN              0
LT FREEZING RAIN          0     HAIL                       0
HEAVY SNOW                0     SNOW                       2
LIGHT SNOW                3     SLEET                      0
FOG                       4     FOG W/VIS <= 1/4 MILE      3
HAZE                      2

-  INDICATES NEGATIVE NUMBERS.
R  INDICATES RECORD WAS SET OR TIED.
MM INDICATES DATA IS MISSING.
T  INDICATES TRACE AMOUNT.
The month of February was quite generous in terms of snowfall at the start. However things quickly transitioned to drier and warmer conditions that lasted most of the rest of the month.
March usually offers healthy snowfall giving us an opportunity to add to those numbers. While there is good snow potential in March, the month also typically brings much warmer temperatures.
March is historically Denver’s snowiest month and brings about 20% of our annual snowfall. Heavy, wet spring snow storms can oftentimes bring the entire month’s snowfall total in one monstrous snow.
We also start the transition to spring and severe weather season and the month typically brings our first thunderstorms of the year. Temperatures climb throughout the month and by the end our average daytime highs are near 60 degrees.
February in Colorado typically brings to an end an extended period when average temperatures are at their lowest. Winter begins to loosen its grip and temperatures get warmer but precipitation is not a particularly common event during the month.
Thus far our snow season is looking in pretty good shape with most basins in the high country reporting above normal snowpack. At lower elevations, we are running above average as well. That is a good thing as February is only our sixth snowiest month so we may not see much snowfall for the balance of the month.
Temperatures however do usually see a nice rebound during the month. Average high temperatures climb from an average of 44 degrees at the start to 50 degrees by the end of February.
January 2016’s weather was notable for only one thing – its lack of anything notable. All in all the month failed to produce anything particularly dramatic. While it was just a bit dry, it wasn’t by much and temperatures came in right near normal.
Only three periods of snowfall occurred during the month. The heaviest of these was on the 7th and 8th but it only amounted to a few inches. High and low temperatures failed to produce any extremes either. We had a few mild days but also lacked extreme cold with no days dipping below zero.
Thornton’s average temperature for the month came in at 30.5 degrees. This was just slightly below Denver’s long term January average of 30.7 degrees. Officially, the Mile High City’s average was warmer than ours at 31.8 degrees.
Temperatures in Thornton ranged from a high of 68.5 degrees on the 30th down to a low of 1.1 degrees on the morning of the 1st. Denver saw a maximum of 65 degrees on the 30th and a low of 5 degrees on the 10th.
In terms of precipitation, we recorded 0.34 inches in Thornton. Out at the airport, Denver was wetter with 0.50 being recorded by their bucket. The January average for Denver is 0.41 inches.
While we did see some snow during the month, no single storm was extraordinary and monthly totals came in below normal. Average for Denver during the month is 7.0 inches. Thornton saw 5.3 inches of the white stuff while Denver was just a bit behind at 4.6 inches.
Thornton, Colorado’s January 2016 temperature summary. (ThorntonWeather.com)Thornton, Colorado’s January 2016 precipitation summary. (ThorntonWeather.com)
CLIMATE REPORT
NATIONAL WEATHER SERVICE DENVER/BOULDER CO
308 PM MST MON FEB 1 2016

...................................

...THE DENVER CO CLIMATE SUMMARY FOR THE MONTH OF JANUARY 2016...

CLIMATE NORMAL PERIOD 1981 TO 2010
CLIMATE RECORD PERIOD 1872 TO 2016

WEATHER         OBSERVED          NORMAL  DEPART  LAST YEAR`S
                 VALUE   DATE(S)  VALUE   FROM    VALUE  DATE(S)
                                          NORMAL
................................................................
TEMPERATURE (F)
RECORD
 HIGH              76   01/27/1888
 LOW              -29   01/09/1875
HIGHEST            65   01/30        76     -11       75  01/27
LOWEST              5   01/10       -29      34      -10  01/04
AVG. MAXIMUM     43.5              44.0    -0.5     46.7
AVG. MINIMUM     20.1              17.4     2.7     21.0
MEAN             31.8              30.7     1.1     33.9
DAYS MAX >= 90      0               0.0     0.0        0
DAYS MAX <= 32      3               5.5    -2.5        5
DAYS MIN <= 32     30              29.4     0.6       27
DAYS MIN <= 0       0               1.7    -1.7        3

PRECIPITATION (INCHES)
RECORD
 MAXIMUM         2.35   1883
 MINIMUM         0.01   1933
                        1934
                        1952

TOTALS           0.50              0.41    0.09     0.38
DAILY AVG.       0.02              0.01    0.01     0.01
DAYS >= .01         5               4.1     0.9        5
DAYS >= .10         3               0.9     2.1        1
DAYS >= .50         0               0.0     0.0        0
DAYS >= 1.00        0               0.0     0.0        0
GREATEST
 24 HR. TOTAL    0.32   01/07 TO 01/08

SNOWFALL (INCHES)
TOTAL             4.6               7.0
RECORD
TOTAL            24.3              1992

DEGREE_DAYS
HEATING TOTAL    1021              1063     -42      958
 SINCE 7/1       3208              3531    -323     3249
COOLING TOTAL       0                 0       0        0
 SINCE 1/1          0                 0       0        0

FREEZE DATES
RECORD
 EARLIEST     09/08/1962
 LATEST       06/08/2007
EARLIEST                        10/07
LATEST                          05/05
..................................................

WIND (MPH)
AVERAGE WIND SPEED              8.5
RESULTANT WIND SPEED/DIRECTION   4/204
HIGHEST WIND SPEED/DIRECTION    32/270    DATE  01/14
HIGHEST GUST SPEED/DIRECTION    38/270    DATE  01/14

SKY COVER
POSSIBLE SUNSHINE (PERCENT)   MM
AVERAGE SKY COVER           0.60
NUMBER OF DAYS FAIR            6
NUMBER OF DAYS PC             19
NUMBER OF DAYS CLOUDY          6

AVERAGE RH (PERCENT)     57

WEATHER CONDITIONS. NUMBER OF DAYS WITH
THUNDERSTORM              0     MIXED PRECIP               0
HEAVY RAIN                0     RAIN                       0
LIGHT RAIN                0     FREEZING RAIN              0
LT FREEZING RAIN          0     HAIL                       0
HEAVY SNOW                0     SNOW                       1
LIGHT SNOW               10     SLEET                      0
FOG                      10     FOG W/VIS <= 1/4 MILE      2
HAZE                      5

-  INDICATES NEGATIVE NUMBERS.
R  INDICATES RECORD WAS SET OR TIED.
MM INDICATES DATA IS MISSING.
T  INDICATES TRACE AMOUNT.
Weather, natural disasters & climate news and information.
 Extreme weather can occur during in month in Colorado we well know. June however is when traditional spring severe weather arrives in the state oftentimes with hail, damaging wind and tornadoes.


 February in Colorado typically brings to an end an extended period when average temperatures are at their lowest. Winter begins to loosen its grip and temperatures get warmer but precipitation is not a particularly common event during the month.
