After a cold and snowy start to the season in October and November, December saw things dry out and warm up. Unfortunately, January 2020 continued the most recent trend with temps well above normal and very little precipitation.
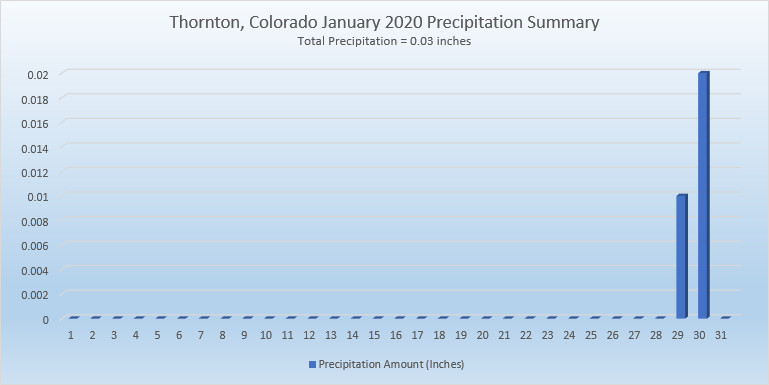
The month was largely uneventful with no notable weather events. Daytime high temperatures were routinely warmer than normal and no precipitation was seen until the very end of the month. When we did finally see some snow on the 29th and 30th, it was minimal, amounting to little more than a dusting.
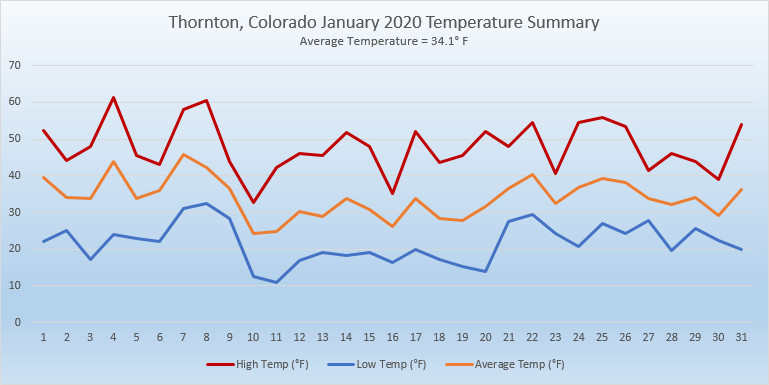
Thornton’s overall average temperature for the month came in at 34.1 degrees. This is well above the long term Denver average for January of 30.7 degrees. As usual, the Mile High City’s official reading at Denver International Airport came in warmer than us at 34.6 degrees.
Temperatures in Thornton ranged from a high of 61.4 degrees on the 4th down to a low of 10.8 degrees on the 11th. Denver saw its maximum reading of 62 degrees on the 4th and 8th and its lowest of 7 degrees on the 11th.
In terms of precipitation, Denver averages 0.27 inches in January. Both Thornton and Denver fell well short with 0.03 inches and 0.14 inches respectively.
Snow was in short supply with 0.6 inches falling in Thornton and 0.9 inches in Denver. Both were far short of the average of 7 inches for Denver in January.
In the end, the month was Thornton’s warmest, driest and least snowy January since ThorntonWeather.com came online in 2007.
Click here to view Thornton’s January 2020 climate report.
From the National Weather Service:
CLIMATE REPORT
NATIONAL WEATHER SERVICE DENVER/BOULDER CO
717 AM MST SAT FEB 1 2020

...................................

...THE DENVER CO CLIMATE SUMMARY FOR THE MONTH OF JANUARY 2020...

CLIMATE NORMAL PERIOD 1981 TO 2010
CLIMATE RECORD PERIOD 1872 TO 2020

WEATHER         OBSERVED          NORMAL  DEPART  LAST YEAR`S
                 VALUE   DATE(S)  VALUE   FROM    VALUE  DATE(S)
                                          NORMAL
................................................................
TEMPERATURE (F)
RECORD
 HIGH              76   01/27/1888
 LOW              -29   01/09/1875
HIGHEST            62   01/08        76     -14       62  01/04
                        01/04
LOWEST              7   01/11       -29      36       -5  01/01
AVG. MAXIMUM     48.0              44.0     4.0     44.6
AVG. MINIMUM     21.1              17.4     3.7     19.5
MEAN             34.6              30.7     3.9     32.0
DAYS MAX >= 90      0               0.0     0.0        0
DAYS MAX <= 32      1               5.5    -4.5        6
DAYS MIN <= 32     31              29.4     1.6       29
DAYS MIN <= 0 0 1.7 -1.7 1 PRECIPITATION (INCHES) RECORD MAXIMUM 2.35 1883 MINIMUM 0.01 1933 1934 1952 TOTALS 0.14 0.41 -0.27 0.75 DAILY AVG. 0.00 0.01 -0.01 0.02 DAYS >= .01         2               4.1    -2.1        6
DAYS >= .10         1               0.9     0.1        2
DAYS >= .50         0               0.0     0.0        0
DAYS >= 1.00        0               0.0     0.0        0
GREATEST
 24 HR. TOTAL    0.13   01/27

SNOWFALL (INCHES)
TOTALS            0.9               7.0              6.2   2019
RECORD           24.3   1992
TOTAL

DEGREE_DAYS
HEATING TOTAL     937              1063    -126     1016
 SINCE 7/1       3436              3531     -95     3388
COOLING TOTAL       0                 0       0        0
 SINCE 1/1          0                 0       0        0

FREEZE DATES
RECORD
 EARLIEST     09/08/1962
 LATEST       06/08/2007
EARLIEST                        10/07
LATEST                          05/05
.................................................................

WIND (MPH)
AVERAGE WIND SPEED              10.1
RESULTANT WIND SPEED/DIRECTION   4/220
HIGHEST WIND SPEED/DIRECTION    40/290    DATE  01/01
HIGHEST GUST SPEED/DIRECTION    53/290    DATE  01/01

SKY COVER
POSSIBLE SUNSHINE (PERCENT)   MM
AVERAGE SKY COVER           0.50
NUMBER OF DAYS FAIR           10
NUMBER OF DAYS PC             17
NUMBER OF DAYS CLOUDY          4

AVERAGE RH (PERCENT)     49

-  INDICATES NEGATIVE NUMBERS.
R  INDICATES RECORD WAS SET OR TIED.
MM INDICATES DATA IS MISSING.
T  INDICATES TRACE AMOUNT.