For the second month in a row, Thornton saw temperatures well above normal and precipitation well below average. While the first half of 2019 started out cool and wet, the second appears to be headed the opposite direction.
High pressure was the dominating feature for the month. This served to keep precipitation away and colder air to our north.
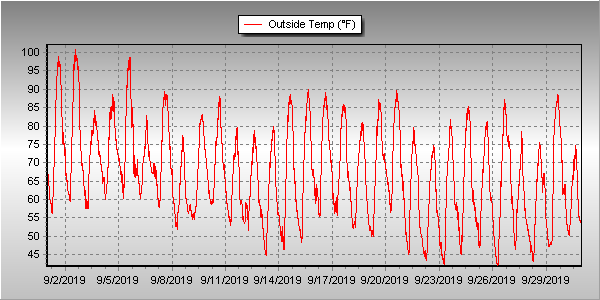
The result was clear and served to make September 2019 one of the warmest Septembers on record. In fact, it was Denver’s second warmest September on record. Thornton wasn’t as warm but here too, it was our second warmest September since Thornton Weather launched 13 years ago.
Overall, Thornton saw an average temperature for the month of 67.0 degrees. This was well above Denver’s long term average temperature for September of 63.4 degrees. Out at DIA where the Mile High City’s official measurements are taken, it was even warmer with an average of 69.3 degrees for the month.
Temperatures in Thornton ranged from a high of 101 degrees on the 1st and 2nd down to a low of 41.7 degrees on the morning of the 26th. Denver’s maximum temperature for the month of 100 degrees came on the 2nd and its coldest of 40 degrees on the 22nd.
Denver’s 100 degree reading on the 2nd was not only a record high for the date, but it also was the latest in the year a 100 degree reading has ever been recorded. The old record was August 16th in 2002. Record high temperatures of 98 degrees were also recorded on the 1st and 5th.
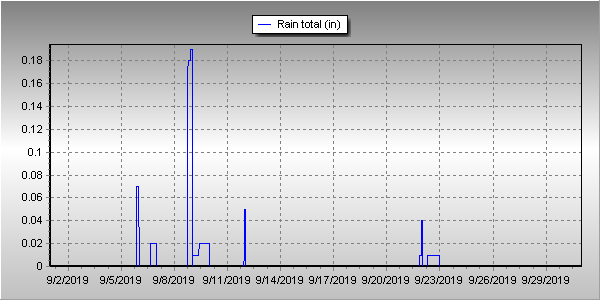
In terms of precipitation, Denver averages 0.96 inches during September. Thornton and Denver recorded identical totals in September 2019 of 0.41 inches, less than half of the average.
Click here to view Thornton’s September 2019 climate report.
CLIMATE REPORT
NATIONAL WEATHER SERVICE DENVER/BOULDER CO
826 AM MDT TUE OCT 1 2019

...................................

...THE DENVER CO CLIMATE SUMMARY FOR THE MONTH OF SEPTEMBER 2019...

CLIMATE NORMAL PERIOD 1981 TO 2010
CLIMATE RECORD PERIOD 1872 TO 2019

WEATHER         OBSERVED          NORMAL  DEPART  LAST YEAR`S
                 VALUE   DATE(S)  VALUE   FROM    VALUE  DATE(S)
                                          NORMAL
................................................................
TEMPERATURE (F)
RECORD
 HIGH             100   09/02/2019
 LOW               17   09/29/1985

HIGHEST           100R  09/02        91       9       96  09/13
LOWEST             40   09/22        35       5       36  09/29
                                                          09/25
AVG. MAXIMUM     85.5              78.5     7.0     82.7
AVG. MINIMUM     53.2              48.3     4.9     52.8
MEAN             69.3              63.4     5.9     67.8
DAYS MAX >= 90      5               3.4     1.6        9
DAYS MAX <= 32      0               0.0     0.0        0
DAYS MIN <= 32      0               0.8    -0.8        0
DAYS MIN <= 0       0               0.0     0.0        0

PRECIPITATION (INCHES)
RECORD
 MAXIMUM         5.61   2013
 MINIMUM            T   1892
                        1944
TOTALS           0.41              0.96   -0.55     0.18
DAILY AVG.       0.01              0.03   -0.02     0.01
DAYS >= .01         3               6.5    -3.5        5
DAYS >= .10         2               3.3    -1.3        0
DAYS >= .50         0               0.6    -0.6        0
DAYS >= 1.00        0               0.1    -0.1        0
GREATEST
 24 HR. TOTAL    0.26   09/08 TO 09/08

SNOWFALL (INCHES)
RECORD SEPTEMBER 17.2   1971
 TOTAL            0.0               1.3

DEGREE_DAYS
HEATING TOTAL      22               125    -103       69
 SINCE 7/1         22               141    -119       78
COOLING TOTAL     158                76      82      160
 SINCE 1/1        915               764     151     1022

FREEZE DATES
RECORD
 EARLIEST     09/08/1962
 LATEST       06/08/2007
EARLIEST                        10/07
LATEST                          05/05
.................................................................

WIND (MPH)
AVERAGE WIND SPEED              10.3
RESULTANT WIND SPEED/DIRECTION   3/165
HIGHEST WIND SPEED/DIRECTION    43/260    DATE  09/08
HIGHEST GUST SPEED/DIRECTION    56/260    DATE  09/08

SKY COVER
POSSIBLE SUNSHINE (PERCENT)   MM
AVERAGE SKY COVER           0.40
NUMBER OF DAYS FAIR           14
NUMBER OF DAYS PC             15
NUMBER OF DAYS CLOUDY          1

AVERAGE RH (PERCENT)     45

-  INDICATES NEGATIVE NUMBERS.
R  INDICATES RECORD WAS SET OR TIED.
MM INDICATES DATA IS MISSING.
T  INDICATES TRACE AMOUNT.