The month of August usually brings respectable amounts of precipitation and by the latter part of the month, cooler temperatures. Mother Nature however had other plans last month keeping the heat on and the moisture at bay.
A dry, westerly flow was dominant for much of the month. While there were a few cool fronts and PM thunderstorms, these failed to amount to much at all and were a rarity.
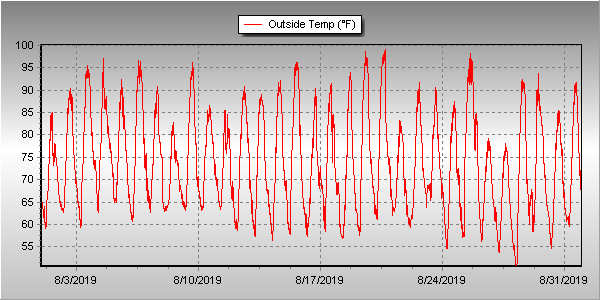
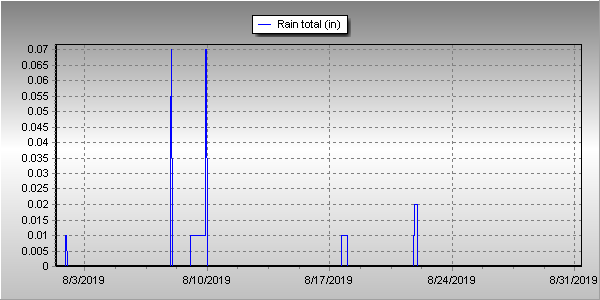
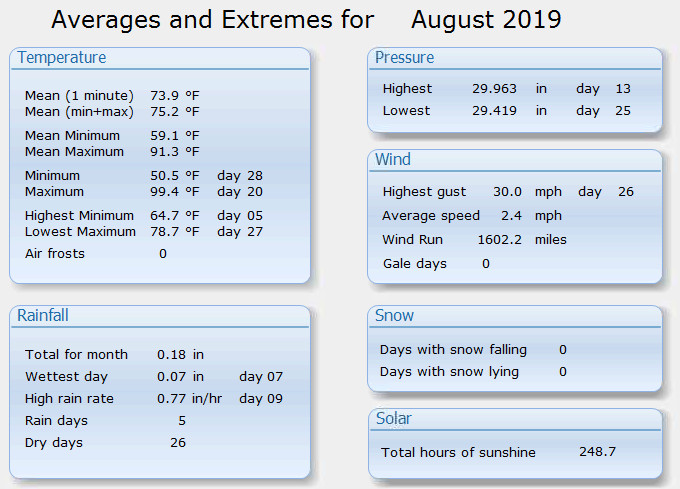
Thornton saw 21 days of 90 degree or higher readings during the month. Only five days saw precipitation and three of those were in virtually negligible amounts.
Thornton’s overall average temperature for the month was 73.9 degrees. This makes it the warmest August since ThorntonWeather.com came online 13 years ago. The reading was a good ways above the long-term Denver average for the month of 72.5 degrees.
At DIA, where Denver’s official temperatures are recorded, it was even warmer with an average of 75.4 degrees. This put August 2019 into the books tying August 2007 as the warmest August ever recorded in the Mile High City.
One temperature record was set in Denver during the month when on the 19th, the high temperature topped out at 99 degrees. This topped the old record high for the date of 97 degrees.
In terms of precipitation, Denver averages 1.69 inches during the month of August. This year, Thornton recorded a paltry 0.18 inch during the month. Denver fared a bit better with 0.58 inches. Both were clearly far short of average and Thornton’s was the least amount of precipitation received in August since ThorntonWeather.com came online 13 years ago.
Click here to view Thornton’s August 2019 climate report.
CLIMATE REPORT
NATIONAL WEATHER SERVICE DENVER/BOULDER CO
910 AM MDT SUN SEP 1 2019

...................................

...THE DENVER CO CLIMATE SUMMARY FOR THE MONTH OF AUGUST 2019...

CLIMATE NORMAL PERIOD 1981 TO 2010
CLIMATE RECORD PERIOD 1872 TO 2019

WEATHER         OBSERVED          NORMAL  DEPART  LAST YEAR`S
                 VALUE   DATE(S)  VALUE   FROM    VALUE  DATE(S)
                                          NORMAL
................................................................
TEMPERATURE (F)
RECORD
 HIGH             105   08/08/1878
 LOW               40   08/26/1910
                        08/25/1910
                        08/24/1910

HIGHEST            99   08/19
LOWEST             51   08/28

AVG. MAXIMUM     90.5              87.2     3.3     86.8
AVG. MINIMUM     60.2              57.9     2.3     58.0
MEAN             75.4              72.5     2.9     72.4
DAYS MAX >= 90     18              11.5     6.5       11
DAYS MAX <= 32      0               0.0     0.0        0
DAYS MIN <= 32      0               0.0     0.0        0
DAYS MIN <= 0 0 0.0 0.0 0
PRECIPITATION (INCHES)
 RECORD MAXIMUM 5.85 1979
 MINIMUM 0.02 1924
TOTALS 0.58 1.69 -1.11 0.93
DAILY AVG. 0.02 0.05 -0.03 0.03
DAYS >= .01         3               8.6    -5.6        7
DAYS >= .10         1               4.3    -3.3        2
DAYS >= .50         0               1.2    -1.2        0
DAYS >= 1.00        0               0.3    -0.3        0
GREATEST
 24 HR. TOTAL    0.46   08/08 TO 08/08           08/14 TO 08/14

SNOWFALL (INCHES)
TOTALS            0.0               0.0

DEGREE_DAYS
HEATING TOTAL       0                10     -10        9
 SINCE 7/1          0                16     -16        9
COOLING TOTAL     326               244      82      247
 SINCE 1/1        757               688      69      862

FREEZE DATES
RECORD
 EARLIEST     09/08/1962
 LATEST       06/08/2007
EARLIEST                        10/07
LATEST                          05/05
.................................................................

WIND (MPH)
AVERAGE WIND SPEED              9.3
RESULTANT WIND SPEED/DIRECTION   2/155
HIGHEST WIND SPEED/DIRECTION    40/020    DATE  08/20
HIGHEST GUST SPEED/DIRECTION    56/020    DATE  08/20

SKY COVER
POSSIBLE SUNSHINE (PERCENT)   MM
AVERAGE SKY COVER           0.50
NUMBER OF DAYS FAIR            9
NUMBER OF DAYS PC             21
NUMBER OF DAYS CLOUDY          1

AVERAGE RH (PERCENT)     50

-  INDICATES NEGATIVE NUMBERS.
R  INDICATES RECORD WAS SET OR TIED.
MM INDICATES DATA IS MISSING.
T  INDICATES TRACE AMOUNT.