The month of September was overall a pleasant one however that came at a price. A very distinct lack of precipitation led to dry conditions, a trend that had started earlier in the summer.
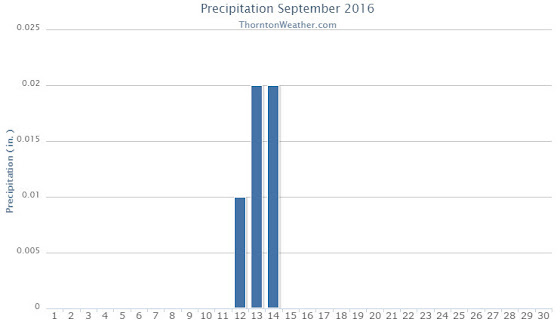
High pressure was the general rule for the month and that helped to ensure that any significant weather potential was steered away from the state. A few troughs and cold fronts mixed things up but in the end, we only saw precipitation on three days during the month and the amounts were negligible.
Thornton’s average temperature for the month came in at 63.7 degrees. This was just slightly above Denver’s long term average for September of 63.4 degrees. Out at the airport where Denver’s official measurements are taken, it was a good bit warmer with an average of 66.0 degrees.
Temperatures here ranged from a high of 91.6 degrees on the 5th of the month down to a low of 39.8 degrees on the 24th. DIA recorded a maximum of 93 degrees, also on the 5th, and a low of 37 degrees on the 10th.
In terms of precipitation, Thornton saw a measly 0.05 inches fall into our rain bucket. The airport fared far better with 0.28 inches. However, both measurements were well below the September average for Denver of 0.96 inches. The reading in Thornton would have been low enough to tie for the third driest reading in Mile High City history.
Click here to view Thornton’s September 2016 climate report.

From the National Weather Service:
CLIMATE REPORT
NATIONAL WEATHER SERVICE DENVER/BOULDER CO
933 AM MDT SAT OCT 1 2016

...................................

...THE DENVER CO CLIMATE SUMMARY FOR THE MONTH OF SEPTEMBER 2016...

CLIMATE NORMAL PERIOD 1981 TO 2010
CLIMATE RECORD PERIOD 1872 TO 2016

WEATHER         OBSERVED          NORMAL  DEPART  LAST YEAR`S
                 VALUE   DATE(S)  VALUE   FROM    VALUE  DATE(S)
                                          NORMAL
................................................................
TEMPERATURE (F)
RECORD
 HIGH              97   09/06/2013
                        09/05/2013
                        09/04/1995
 LOW               17   09/29/1985
HIGHEST            93   09/05        91       2       92  09/02
LOWEST             37   09/10        35       2       44  09/19
AVG. MAXIMUM     82.3              78.5     3.8     85.2
AVG. MINIMUM     49.7              48.3     1.4     53.5
MEAN             66.0              63.4     2.6     69.4
DAYS MAX >= 90      6               3.4     2.6        7
DAYS MAX <= 32      0               0.0     0.0        0
DAYS MIN <= 32      0               0.8    -0.8        0
DAYS MIN <= 0 0 0.0 0.0 0 PRECIPITATION (INCHES) RECORD MAXIMUM 5.61 2013 MINIMUM T 1892 1944 TOTALS 0.28 0.96 -0.68 0.11 DAILY AVG. 0.01 0.03 -0.02 0.00 DAYS >= .01         4               6.5    -2.5        3
DAYS >= .10         1               3.3    -2.3        0
DAYS >= .50         0               0.6    -0.6        0
DAYS >= 1.00        0               0.1    -0.1        0
GREATEST
 24 HR. TOTAL    0.18   09/12 TO 09/12           08/31 TO 09/01

SNOWFALL (INCHES)
RECORDS
 TOTAL            0.0              1.3
RECORD SEPTEMBER 17.2                      1971

DEGREE_DAYS
HEATING TOTAL      64               125     -61        9
 SINCE 7/1         79               141     -62       27
COOLING TOTAL      99                76      23      148
 SINCE 1/1        861               764      97      861

FREEZE DATES
RECORD
 EARLIEST     09/08/1962
 LATEST       06/08/2007
EARLIEST                        10/07
LATEST                          05/05
.....................................................

WIND (MPH)
AVERAGE WIND SPEED              9.5
RESULTANT WIND SPEED/DIRECTION   2/171
HIGHEST WIND SPEED/DIRECTION    37/170    DATE  09/23
HIGHEST GUST SPEED/DIRECTION    51/200    DATE  09/04

SKY COVER
POSSIBLE SUNSHINE (PERCENT)   MM
AVERAGE SKY COVER           0.40
NUMBER OF DAYS FAIR           13
NUMBER OF DAYS PC             13
NUMBER OF DAYS CLOUDY          4

AVERAGE RH (PERCENT)     45

WEATHER CONDITIONS. NUMBER OF DAYS WITH
THUNDERSTORM              6     MIXED PRECIP               0
HEAVY RAIN                0     RAIN                       0
LIGHT RAIN                6     FREEZING RAIN              0
LT FREEZING RAIN          0     HAIL                       0
HEAVY SNOW                0     SNOW                       0
LIGHT SNOW                0     SLEET                      0
FOG                       4     FOG W/VIS <= 1/4 MILE      3
HAZE                      4

-  INDICATES NEGATIVE NUMBERS.
R  INDICATES RECORD WAS SET OR TIED.
MM INDICATES DATA IS MISSING.
T  INDICATES TRACE AMOUNT.