Thornton and the Denver area closed out 2013 with a display of typically highly variable weather. We recorded some record low temperatures followed by unseasonably warm conditions. One thing that was lacking was snow.
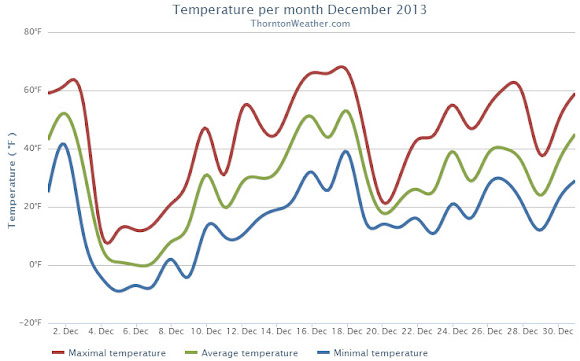
The first three days of the month started out quite mild with highs well above normal. That changed quickly midday on the third as low pressure moved in bringing an extended Arctic blast.
For six straight days high temperatures remained stubbornly below freezing and lows dipped into the single digits. The cold snap was notable but not record-setting in terms of length. Two daily low temperature records were tied or broken however.
Warmer weather returned on the 10th as the mercury finally started to climb. Unseasonably warm temperatures became the rule for the next nine days that included a record high temperature on the 18th.
The last third of the month was a bit more variable with its ups and downs but overall warmer than normal conditions.
Overall Thornton’s monthly average temperature came in at 29.2 degrees. Out at Denver International Airport where the Mile High City’s official stats are recorded, it was a bit cooler with an average of 28.4 degrees. Both were below Denver’s December average of 30.0 degrees.
Thornton recorded nine days with high temperatures that failed to reach 32 degrees. On five days, low temperatures dropped below zero. Denver saw eight days with highs below freezing, six with lows below zero.
The warmest temperature of the month in Thornton came on the 18th when we recorded 66.8 degrees. Our coldest was -9.3 degrees on the 5th. Denver’s warmest day was on the 18th as well with a high of 68 degrees. Its lowest temperature was -15 degrees on the 5th.
Four temperature records were tied or broken in Denver.
The low temperature of -13 degrees on December 4th shattered the old record low for the date of -5 degrees last set in 2008. The following day, on December 5th, the low temperature of -15 degrees tied the record low last set in 1972.
The mild weather December 18 saw two records. The high of 68 degrees broke the previous high temperature record for the date of 66 degrees last set in 1979. Also, the day tied the record high minimum for the 18th of 40 degrees set in 1917.
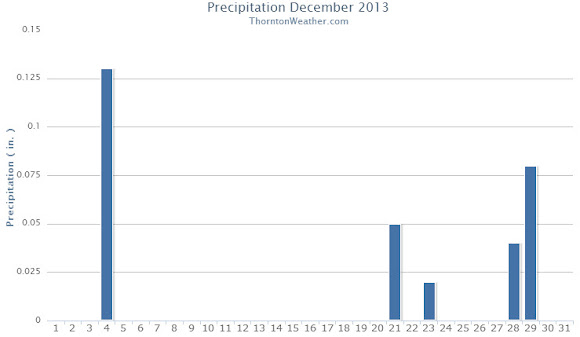
Precipitation for the month of December 2013 was not as noteworthy as the temperatures. Thornton recorded only 0.24 inches in our bucket while Denver received 0.25 inches. Both were a good bit below the December average of 0.35 inches.
Snow was similarly less than extraordinary. Thornton measured 5.7 inches of the white stuff while Denver lagged that with 4.7 inches. Both totals were below the normal for December of 8.5 inches. Seasonal snowfall totals at this point are about half of what they normally are.
Click here to view Thornton’s December 2013 climate summary.
CLIMATE REPORT
NATIONAL WEATHER SERVICE BOULDER, CO
200 AM MST WED JAN 1 2014

...................................

...THE DENVER CO CLIMATE SUMMARY FOR THE YEAR OF 2013...

CLIMATE NORMAL PERIOD 1981 TO 2010
CLIMATE RECORD PERIOD 1872 TO 2013

WEATHER         OBSERVED          NORMAL  DEPART  LAST YEAR`S
                 VALUE   DATE(S)  VALUE   FROM    VALUE  DATE(S)
                                          NORMAL
................................................................
TEMPERATURE (F)
RECORD
 HIGH             105   06/26/2012
                        06/25/2012
                        07/20/2005
 LOW              -29   01/09/1875
HIGHEST           100   07/11        64      36      105  06/26
                        06/11                             06/25
LOWEST            -15   12/05        36     -51       -6  01/11
AVG. MAXIMUM     63.9              64.7    -0.8     68.4
AVG. MINIMUM     36.3              36.3     0.0     39.3
MEAN             50.1              50.5    -0.4     53.9
DAYS MAX >= 90     54              39.6    14.4       73
DAYS MAX <= 32     29              20.0     9.0       19
DAYS MIN <= 32    169             156.9    12.1      132
DAYS MIN <= 0      11               5.8     5.2        4
PRECIPITATION (INCHES)
RECORD
 MAXIMUM        23.31   1196
 MINIMUM         7.29   2008
TOTALS          17.60             14.30    3.30    10.11
DAILY AVG.       0.05              0.04    0.01     0.03
DAYS >= .01        82              79.7     2.3       52
DAYS >= .10        42              34.9     7.1       23
DAYS >= .50         8               7.6     0.4        9
DAYS >= 1.00        3               2.3     0.7        1
GREATEST
 24 HR. TOTAL    2.39   MM                       12/31 TO 12/31
                                                          12/31 TO 12/31
                                                          12/31 TO 12/31
 STORM TOTAL       MM                                 MM
 (MM/DD(HH))            MM                    12/31(00) TO 12/31(00)
                                                 12/31(00) TO 12/31(00)1
                                                 12/31(00) TO 12/31(00)1

SNOWFALL (INCHES)
RECORDS
 TOTAL             MM   5
 24 HR TOTAL       MM
 SNOW DEPTH        MM   MM
TOTALS           74.1              53.8    20.3     38.5
 LIQUID EQUIV    7.41              5.40    2.01     3.85
SINCE 7/1         8.1              22.5   -14.4     12.4
 LIQUID 7/1      0.81              2.20   -1.39     1.24
SNOWDEPTH AVG.      0                MM      MM        0
DAYS >= TRACE      60              33.3    26.7       36
DAYS >= 1.0        20              16.3     3.7       13
GREATEST
 SNOW DEPTH         9   02/25                         11  02/04
 24 HR TOTAL      9.1   MM                       12/31 TO 12/31
                                                          12/31 TO 12/31
                                                          12/31 TO 12/31
 STORM TOTAL       MM                                 MM
 (MM/DD(HH))            MM                    12/31(00) TO 12/31(00)
                                                 12/31(00) TO 12/31(00)1
                                                 12/31(00) TO 12/31(00)1

DEGREE_DAYS
HEATING TOTAL    6302              6059     243     5198
 SINCE 7/1         MM              2468      MM       MM
COOLING TOTAL     999                 0     999     1236
 SINCE 1/1        999               769     230     1236

FREEZE DATES
RECORD
 EARLIEST     09/08/1962
 LATEST       06/08/2007
EARLIEST                        10/07
LATEST                          05/05
..................................................

WIND (MPH)
AVERAGE WIND SPEED              9.7
RESULTANT WIND SPEED/DIRECTION   2/201
HIGHEST WIND SPEED/DIRECTION    64/060    DATE  06/18
HIGHEST GUST SPEED/DIRECTION    97/040    DATE  06/18

SKY COVER
POSSIBLE SUNSHINE (PERCENT)   MM
AVERAGE SKY COVER           0.60
NUMBER OF DAYS FAIR           69
NUMBER OF DAYS PC            232
NUMBER OF DAYS CLOUDY         64

AVERAGE RH (PERCENT)     52

WEATHER CONDITIONS. NUMBER OF DAYS WITH
THUNDERSTORM              0     MIXED PRECIP               0
HEAVY RAIN               14     RAIN                      25
LIGHT RAIN               80     FREEZING RAIN              0
LT FREEZING RAIN          4     HAIL                       0
HEAVY SNOW               11     SNOW                      23
LIGHT SNOW               58     SLEET                      0
FOG                     105     FOG W/VIS <= 1/4 MILE     33
HAZE                     88

-  INDICATES NEGATIVE NUMBERS.
R  INDICATES RECORD WAS SET OR TIED.
MM INDICATES DATA IS MISSING.
T  INDICATES TRACE AMOUNT.