Following a cool June, summer heated up in earnest in July. Temperatures warmed as they always do in July and were a bit warmer than normal and were coupled with typical PM thunderstorms.
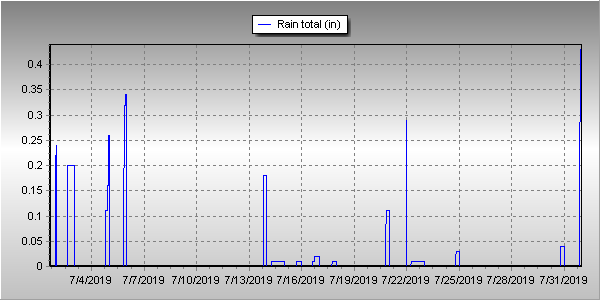
The first eight days of the month saw a few warmer than normal readings but nothing too extraordinary. We did also enjoy three days with some nice, wetting thunderstorms.
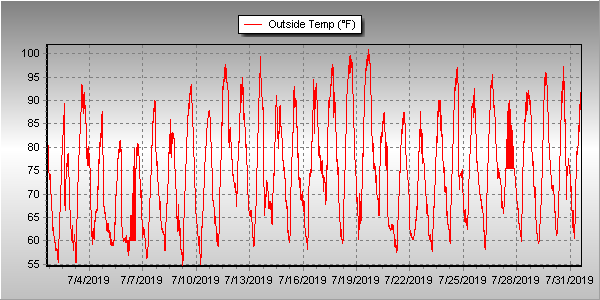
After that, the heat kicked on and we registered nine straight days of 90+ degree readings from the 11th to the 18th. The last two days of the period also saw our first two 100+ degree days.
We then had a bit of a break from the heat for a few days before stringing together another nine 90+ degree readings.
Thornton’s overall average temperature for the month came in at 74.7 degrees. This was above the long term Denver average of 74.2 degrees for July. Out at DIA where Denver’s official measurements are taken, it was a good bit warmer with an average of 75.7 degrees.
Thornton’s highs ranged from a maximum of 101 degrees on the 19th down to a low of 54.5 degrees on the 9th. Denver also saw its maximum of 101 degrees on the same day and its coolest reading of 52 degrees on the 10th.
Denver tied record high temperatures on the 18th and 19th of 99 degrees and 101 degrees (set in 1998 and 2005 respectively).
In terms of precipitation, Thornton saw 2.18 inches fall in its bucket while Denver notched a bit more at 2.42 inches. The Denver average for July is 2.16 inches.
Click here to view Thornton’s July 2019 climate report.
CLIMATE REPORT
NATIONAL WEATHER SERVICE DENVER/BOULDER CO
724 AM MDT THU AUG 1 2019

...................................

...THE DENVER CO CLIMATE SUMMARY FOR THE MONTH OF JULY 2019...

CLIMATE NORMAL PERIOD 1981 TO 2010
CLIMATE RECORD PERIOD 1872 TO 2019

WEATHER         OBSERVED          NORMAL  DEPART  LAST YEAR`S
                 VALUE   DATE(S)  VALUE   FROM    VALUE  DATE(S)
                                          NORMAL
................................................................
TEMPERATURE (F)
RECORD
 HIGH             105   07/20/2005
 LOW               42   07/04/1903
                        07/31/1873
HIGHEST           101   07/19
LOWEST             52   07/10

AVG. MAXIMUM     91.1              89.4     1.7     90.2
AVG. MINIMUM     60.4              58.9     1.5     60.3
MEAN             75.7              74.2     1.5     75.3
DAYS MAX >= 90     20              16.0     4.0       19
DAYS MAX <= 32      0               0.0     0.0        0
DAYS MIN <= 32      0               0.0     0.0        0
DAYS MIN <= 0       0               0.0     0.0        0

PRECIPITATION (INCHES)
RECORD
 MAXIMUM         6.41   1965
 MINIMUM         0.01   1901
TOTALS           2.42              2.16    0.26     1.03
DAILY AVG.       0.08              0.07    0.01     0.03
DAYS >= .01         9               8.3     0.7        8
DAYS >= .10         5               4.3     0.7        3
DAYS >= .50         2               1.4     0.6        0
DAYS >= 1.00        1               0.7     0.3        0
GREATEST
 24 HR. TOTAL    1.10   07/22 TO 07/22           07/23 TO 07/23

SNOWFALL (INCHES)
TOTALS 0.0               0.0

DEGREE_DAYS
HEATING TOTAL       0                 6      -6        0
 SINCE 7/1          0                 6      -6        0
COOLING TOTAL     339               289      50      326
 SINCE 1/1        431               444     -13      615

FREEZE DATES
RECORD
 EARLIEST     09/08/1962
 LATEST       06/08/2007
EARLIEST                        10/07
LATEST                          05/05
.................................................................

WIND (MPH)
AVERAGE WIND SPEED              9.7
RESULTANT WIND SPEED/DIRECTION   3/190
HIGHEST WIND SPEED/DIRECTION    55/280    DATE  07/22
HIGHEST GUST SPEED/DIRECTION    80/290    DATE  07/22

SKY COVER
POSSIBLE SUNSHINE (PERCENT)   MM
AVERAGE SKY COVER           0.50
NUMBER OF DAYS FAIR            5
NUMBER OF DAYS PC             24
NUMBER OF DAYS CLOUDY          2

AVERAGE RH (PERCENT)     50

-  INDICATES NEGATIVE NUMBERS.
R  INDICATES RECORD WAS SET OR TIED.
MM INDICATES DATA IS MISSING.
T  INDICATES TRACE AMOUNT.