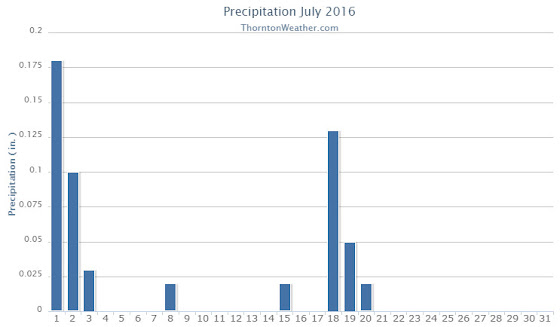
While the month of July seemed hot and dry, statistics show that only one of those two conditions held true. We definitely saw a big time lack of precipitation but temperatures averaged out to near normal.
High pressure was the dominate feature for the month leading to overall dry conditions. We started out cooler than normal and somewhat wet for the first two days of the month. That however changed quickly.
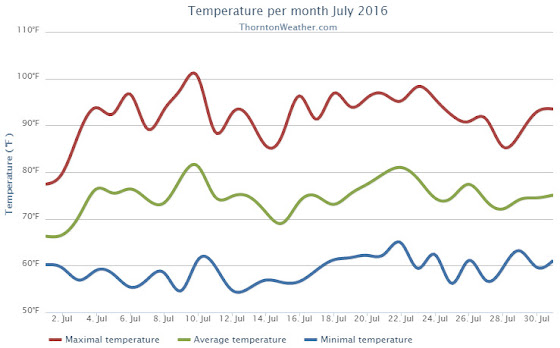
From the 3rd through the 17th of the month, Thornton saw temperatures largely remain above normal. Only two days during that period saw precipitation and both were minimal amounts. We saw our hottest temperature of the year to date and our only 100-degree temperature reading of the year on the 10th when the mercury topped out at 100.4 Degrees.
On the 14th and 15th of the month, we had a brief respite from the heat as temperatures were a bit below normal. However, we then put together a string of 12 straight days of 90 degree or hotter readings.
The 28th and 29th then broke the streak with temperatures in the mid to upper 80s. The month then closed with two days of above normal readings.
Thornton’s overall average temperature for the month came in at 74.7 degrees. This is just above the long term Denver average for July of 74.2 degrees. Out at DIA where the Mile High City’s official measurements are taken, the average for this July was much higher at 76.2 degrees.
Temperatures in Thornton ranged from the aforementioned 100.4 degrees on the 10th down to a low of 54.6 degrees on the morning of the 9th. Denver’s official high for the month was 102 degrees on the 10th and its low of 51 degrees came on the 12th.
In terms of precipitation, Denver averages 2.16 inches during the July. Thornton fell far short of that with a paltry 0.55 inches of rain in our bucket. The airport, while receiving nearly double our total at 1.09 inches, was well short of average as well.
Click here to view Thornton’s July 2016 climate report.
From the National Weather Service:
CLIMATE REPORT
NATIONAL WEATHER SERVICE DENVER/BOULDER CO
235 AM MDT MON AUG 1 2016

...................................

...THE DENVER CO CLIMATE SUMMARY FOR THE MONTH OF JULY 2016...

CLIMATE NORMAL PERIOD 1981 TO 2010
CLIMATE RECORD PERIOD 1872 TO 2016

WEATHER         OBSERVED          NORMAL  DEPART  LAST YEAR`S
                 VALUE   DATE(S)  VALUE   FROM    VALUE  DATE(S)
                                          NORMAL
................................................................
TEMPERATURE (F)
RECORD
 HIGH             105   07/20/2005
 LOW               42   07/04/1903
                        07/31/1873
HIGHEST           102   07/10         M      -3       97  07/27
LOWEST             51   07/12         M       9       52  07/28
AVG. MAXIMUM     92.0              89.4     2.6     87.6
AVG. MINIMUM     60.5              58.9     1.6     57.9
MEAN             76.2              74.2     2.0     72.8
DAYS MAX >= 90     22              16.0     6.0       16
DAYS MAX <= 32      0               0.0     0.0        0
DAYS MIN <= 32      0               0.0     0.0        0
DAYS MIN <= 0       0               0.0     0.0        0

PRECIPITATION (INCHES)
RECORD
 MAXIMUM         6.41   1965
 MINIMUM         0.01   1901
TOTALS           1.07              2.16   -1.09     1.06
DAILY AVG.       0.03              0.07   -0.04     0.03
DAYS >= .01         6               8.3    -2.3       12
DAYS >= .10         4               4.3    -0.3        3
DAYS >= .50         1               1.4    -0.4        0
DAYS >= 1.00        0               0.7    -0.7        0
GREATEST
 24 HR. TOTAL    0.61   07/01 TO 07/01           07/18 TO 07/18
                        06/30 TO 07/01                    07/29 TO 07/29
                        07/01 TO 07/01                    07/29 TO 07/29
 STORM TOTAL       MM                                 MM
 (MM/DD(HH))            MM                    07/18(00) TO 07/18(00)
                                                 07/29(00) TO 07/29(00)9
                                                 07/29(00) TO 07/29(00)9

SNOWFALL (INCHES)
RECORDS
 TOTAL             MM   MM
TOTALS            0.0               0.0

DEGREE_DAYS
HEATING TOTAL       0                 6      -6        5
 SINCE 7/1          0                 6      -6        5
COOLING TOTAL     356               289      67      251
 SINCE 1/1        544               444     100      409

FREEZE DATES
RECORD
 EARLIEST     09/08/1962
 LATEST       06/08/2007
EARLIEST                        10/07
LATEST                          05/05
..........................................................

WIND (MPH)
AVERAGE WIND SPEED              10.2
RESULTANT WIND SPEED/DIRECTION   3/169
HIGHEST WIND SPEED/DIRECTION    54/340    DATE  07/24
HIGHEST GUST SPEED/DIRECTION    74/340    DATE  07/24

SKY COVER
POSSIBLE SUNSHINE (PERCENT)   MM
AVERAGE SKY COVER           0.50
NUMBER OF DAYS FAIR           10
NUMBER OF DAYS PC             19
NUMBER OF DAYS CLOUDY          2

AVERAGE RH (PERCENT)     46

WEATHER CONDITIONS. NUMBER OF DAYS WITH
THUNDERSTORM             12     MIXED PRECIP               0
HEAVY RAIN                1     RAIN                       0
LIGHT RAIN               13     FREEZING RAIN              0
LT FREEZING RAIN          0     HAIL                       0
HEAVY SNOW                0     SNOW                       0
LIGHT SNOW                0     SLEET                      0
FOG                       3     FOG W/VIS <= 1/4 MILE      0
HAZE                      1

-  INDICATES NEGATIVE NUMBERS.
R  INDICATES RECORD WAS SET OR TIED.
MM INDICATES DATA IS MISSING.
T  INDICATES TRACE AMOUNT.