|
Updated | Federal weather forecasters released their winter outlook Thursday, and it doesn’t look good for drought-stricken northern California, Oregon and Washington state. A strong El Niño this winter is predicted to intensify the Western drought through at least January, the National Oceanic and Atmospheric Administration announced. Earlier this week, NASA released a new image of… Continue reading El Niño Won’t Relieve West’s Drought, NOAA Predicts |
Tag Archives: Drought
Video: NASA showcases weather and climate events of 2013 as seen from space
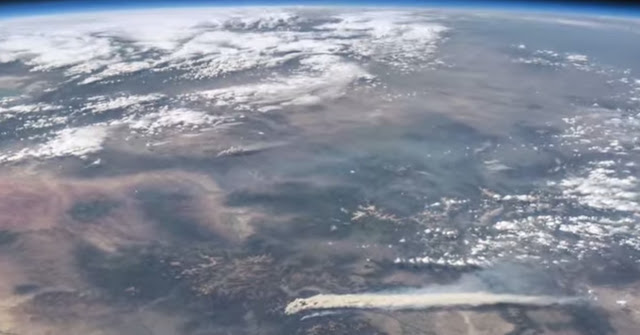
A stunning video released by NASA this week provides a bird’s eye view of some of the Earth’s most significant weather and climate events of last year.
Using images and movies from satellites and the International Space Station, scenes from across the globe are shown in the video titled “Earth from Orbit 2013.”
Colorado and surrounding states however will draw the most attention from many locally.
From their perch high above, imagery of Colorado’s West Fork Fire in June 2013 is seen as well as the effects of the September floods.
To our south, the drought in New Mexico is seen having taken its toll on Elephant Butte Reservoir in New Mexico. The veritable explosion of storm cells that lea to devastation in Oklahoma during a May tornado outbreak are also shown.
Below the video you will find a description of each scene and links to more imagery.
From NASA – Published on Apr 21, 2014:
A fleet of orbiting satellites monitors Earth constantly. The satellites from NASA and other space agencies give us a fresh, wide perspective on things that we can see from the ground — and things that we can’t.
A look back at Earth in 2013 from the viewpoint of orbit reveals the kind of data gathering and technical achievement that are the reason NASA puts Earth-observing satellites in space. A visualization of satellite and computer model data shows how a cloud of dust from the Chelyabinsk meteor moved around the world. NASA satellites measured the intensity of wildfires, the salinity of the oceans and rainfall around the globe — whether it was too little or too much.
To learn more about NASA’s Earth science in 2014, please visit: www.nasa.gov/earthrightnow
Imagery used in this video, in order:
Views of a Distant Earth
http://earthobservatory.nasa.gov/IOTD…
Earth and Moon
http://svs.gsfc.nasa.gov/vis/a000000/…
Current Earth Observing Fleet
http://svs.gsfc.nasa.gov/vis/a030000/…
Term3_ISS From Night to Day to Night Again
http://eol.jsc.nasa.gov/Videos/CrewEa…
Astronaut View of Fires in Colorado
http://earthobservatory.nasa.gov/Natu…
Extensive Ice Fractures in the Beaufort Sea
http://earthobservatory.nasa.gov/IOTD…
Dune Movement Around Aorounga
http://earthobservatory.nasa.gov/IOTD…
San Francisco Region at Night
http://earthobservatory.nasa.gov/IOTD…
Whiting Event, Lake Ontario
http://earth.jsc.nasa.gov/debrief/ISS…
Dust Plumes over the Mediterranean
http://earthobservatory.nasa.gov/Natu…
Mt. St. Helens
http://earthobservatory.nasa.gov/IOTD…
El Paso
http://earthobservatory.nasa.gov/IOTD…
Close-Up of Flooding in Mozambique
http://earthobservatory.nasa.gov/IOTD…
Drought Dries Elephant Butte Reservoir
http://earthobservatory.nasa.gov/IOTD…
Oklahoma Tornadoes
http://earthobservatory.nasa.gov/Natu…
Floods in Colorado
http://earthobservatory.nasa.gov/Natu…
Pavlof Volcano
http://earthobservatory.nasa.gov/Natu…
Swirling Sediment Reveals Erosive Power of New England Storm
http://earthobservatory.nasa.gov/IOTD…
Never at Rest: The Air over Los Angeles
http://svs.gsfc.nasa.gov/vis/a000000/…
Measuring Soil Moisture from Space
http://svs.gsfc.nasa.gov/vis/a030000/…
Antarctic Bedrock
http://svs.gsfc.nasa.gov/vis/a000000/…
Seeing Photosynthesis from Space
http://svs.gsfc.nasa.gov/vis/a010000/…
Greenland’s Mega Canyon
http://svs.gsfc.nasa.gov/vis/a000000/…
Chelyabinsk Bolide Plume as seen by NPP and NASA Models
http://svs.gsfc.nasa.gov/vis/a000000/…
Narrated Distributed Water Balance of the Nile Basin
http://svs.gsfc.nasa.gov/vis/a010000/…
NEO Observations (various)
http://svs.gsfc.nasa.gov/cgi-bin/advs…
United States sees record-setting number of billion dollar disasters in 2011

According to the National Climatic Data Center (NCDC), the U.S. has seen a record number of billion dollar disasters in 2011. Thus far this year the nation has seen 10 such disasters and with hurricane season far from over, it seems likely the number will grow.
The events range from the Groundhog Day Blizzard to Hurricane Irene’s recent devastating blow to the East Coast. In all, the disasters represent more than $35 billion in losses and that is no including Irene’s yet to be determined toll.
Below is the list and narrative for each disaster from the NCDC. For the latest disaster news, be sure to check out the Natural Disasters Examiner.
Hurricane Irene, August 20-29, 2011 While it will take several months to determine an accurate estimate of the damage from Hurricane Irene, there is no question it will rank as the 10th billion-dollar weather event of the year. This 10th U.S. billion-dollar disaster officially breaks the annual record dating back to 1980.
Upper Midwest Flooding, Summer, 2011 Melting of an above-average snow pack across the Northern Rocky Mountains combined with above-average precipitation caused the Missouri and Souris Rivers to swell beyond their banks across the Upper Midwest (MT, ND, SD, NE, IA, KS, MO). An estimated 11,000 people were forced to evacuate Minot, North Dakota due to the record high water level of the Souris River, where 4,000 homes were flooded. Numerous levees were breached along the Missouri River, flooding thousands of acres of farmland. Estimated losses exceed $2.0 billion as the event continues to unfold (as of 8/15). The flooding also stretched into the Canadian Prairies, where property and agriculture losses were expected to surpass $1.0 billion, at least 5 deaths.
Mississippi River flooding, Spring-Summer, 2011 Persistent rainfall (nearly 300 percent normal precipitation amounts in the Ohio Valley) combined with melting snowpack caused historical flooding along the Mississippi River and its tributaries. Estimated economic loss ranges from $2.0-4.0 billion; at least 2 deaths. Below are more detailed stats, which are preliminary, as the event continues to unfold (as of 8/15): $500 million to agriculture in Arkansas; $320 million in damage to Memphis, Tennessee; $800 million to agriculture in Mississippi; $317 million to agriculture and property in Missouri’s Birds Point-New Madrid Spillway; $80 million for the first 30 days of flood fighting efforts in Louisiana.
Southern Plains/Southwest Drought, Heatwave, & Wildfires, Spring-Summer, 2011 Drought, heatwave, and wildfires have created major impacts across the Texas, Oklahoma, New Mexico, Arizona, southern Kansas, and western Arkansas and Louisiana. In Texas and Oklahoma, respectively, 75% and 63% of range and pasture conditions were classified in ‘very poor’ condition as of mid-August. Wildfire fighting/suppression costs for the region are also ~$1 million / day with over 2,000 homes and structures lost. The total direct losses (as of August 15) to agriculture, cattle and structures are well over $5.0 billion; both direct and total economic losses will rise dramatically as the event continues.
Midwest/Southeast Tornadoes, May 22-27, 2011 Outbreak of tornadoes over central and southern states (MO, TX, OK, KS, AR, GA, TN, VA, KY, IN, IL, OH, WI, MN, PA) with an estimated 180 tornadoes and 177 deaths. Notably, an EF-5 tornado struck Joplin, MO resulting in at least 141 deaths, making it the deadliest single tornado to strike the U.S. since modern tornado record keeping began in 1950. Over $4.9 billion insured losses for event; total losses greater than $7.0 billion; 177 deaths.
Southeast/Ohio Valley/Midwest Tornadoes, April 25-30, 2011 Outbreak of tornadoes over central and southern states (AL, AR, LA, MS, GA, TN, VA, KY, IL, MO, OH, TX, OK) with an estimated 305 tornadoes and 327 deaths. Of those fatalities, 240 occurred in Alabama. The deadliest tornado of the outbreak, an EF-5, hit northern Alabama, killing 78 people. Several major metropolitan areas were directly impacted by strong tornadoes including Tuscaloosa, Birmingham, and Huntsville in Alabama and Chattanooga, Tennessee, causing the estimated damage costs to soar. Over $6.6 billion insured losses; total losses greater than $9.0 billion; 327 deaths.
Midwest/Southeast Tornadoes, April 14-16, 2011 Outbreak of tornadoes over central and southern states (OK, TX, AR, MS, AL, GA, NC, SC, VA, PA) with an estimated 160 tornadoes. Despite the large overall number of tornadoes, few were classified as intense, with just 14 EF-3, and no EF-4 or EF-5 tornadoes identified. Over $1.4 billion insured losses; total losses greater than $2.0 billion; 38 deaths [22 of which were in North Carolina].
Southeast/Midwest Tornadoes, April 8-11, 2011 Outbreak of tornadoes over central and southern states (NC, SC, TN, AL, TX, OK, KS, IA, WI) with an estimated 59 tornadoes. Over $1.5 billion insured losses; total losses greater than $2.2 billion; numerous injuries, 0 deaths.
Midwest/Southeast Tornadoes, April 4-5, 2011 Outbreak of tornadoes over central and southern states (KS, MO, IA, IL, WI, KY, GA, TN, NC, SC) with an estimated 46 tornadoes. Over $1.6 billion insured losses; total losses greater than $2.3 billion; 9 deaths.
Groundhog Day Blizzard, Jan 29-Feb 3, 2011 Large winter storm impacting many central, eastern and northeastern states. The city of Chicago was brought to a virtual standstill as between 1 and 2 feet of snow fell over the area. Insured losses greater than $1.1 billion; total losses greater than $2.0 billion; 36 deaths.
NASA satellite reveals January had fifth largest snow cover in past 45 years

How much snow has fallen this season in Colorado all depends on where you are. The high country has continued to see snowfall far in excess of normal while here on the Plains we remain mostly dry. For the nation, a new NASA satellite image reveals that 71 percent of it was covered in snow at one point last month.
The new image (right), taken by NASA’s Terra satellite using its Moderate Resolution Imaging Spectroradiometer (MODIS), reveals a snow covered contiguous United States in January.
The image uses false colors to show the snow extent and the length of time it was on the ground. White areas were completely covered with snow for most of the month whereas the pale green areas had snow for part of the month or were only partly snowy.
On January 12, 71 percent was covered in snow – the fifth largest amount of snow cover in the past 45 years. In fact, 49 of the 50 states had snow thanks to a significant winter storm that pummeled the Gulf Coast states with Florida being the only hold out.
Despite the expansive snow cover, the National Climatic Data Center said that January 2011 was the ninth-driest January in the United States since 1894. Further, while snow reached the Gulf Coast states, the southern half of the nation has been very dry with a large area from stretching Arizona to Virginia considered in various stages of drought.
Eastern Colorado is now seeing areas of moderate to severe drought as the lack of snowfall we have seen takes its toll. In Denver we have recorded only 18.1 inches of snow so far this season – 21.5 inches below what we would normally see through the end of February. Thornton has barely fared better recording 18.5 inches so far.
From Examiner.com:
- More Satellite images of the rare snow that extended across the southern U.S. here
- NASA satellite picture shows hurricane-looking storm pummeling U.S. East Coast
Related:
Ranking the top 10 Colorado weather events of the past 10 years
")
There is a lot that can be said about the weather in Colorado but ‘boring’ is not usually a term associated with it. Anyone who has lived in the Centennial State for very long quickly experiences a weather-related event that will give them memories for a lifetime.
From major snowstorms and blizzards to tornadoes, wildfires, scorching heat and damaging hail storms Colorado weather can and does bring it all to the table. The Denver office of the National Weather Service has released a list of what local meteorologists rank as the top 10 weather events of the past 10 years.
For some it may be a blizzard that buried the Mile High City in a heavy blanket of snow and brought everything to a standstill. Others will remember the heavy smoke from fires burning in the mountains destroying hundreds of thousands of acres. The tragedy tornadoes bring to Colorado in terms of destruction and loss of life may be what others remember.
Over the past 10 years many memorable weather events have occurred that fully display the sheer variety of weather Colorado receives. A team of meteorologists serving Colorado analyzed these events and ranked them based on meteorological intensity and their human and economic impact.
Continue reading Ranking the top 10 Colorado weather events of the past 10 years