 Another year is in the books and as we look back at 2013’s weather, we see Thornton – and indeed much of the state – saw cooler and wetter than normal conditions.
In terms of temperatures, Thornton saw an average overall annual temperature of 49.3 degrees. Out at Denver International Airport where the Mile High City’s official records are kept, the average was warmer at 50.1 degrees. By comparison, Denver’s 1981 to 2010 annual average temperature is 50.4 degrees.
Thornton recorded 47 days with temperatures at or above the 90 degree mark. At DIA 54 such days were recorded. Both were above the average of 40 90 degree days per year.
The hottest temperature recorded during the year in Thornton came on June 11th when the mercury climbed to 99.2 degrees. Denver’s hottest temperature of 100 degrees came on June 11th and July 11th.
At the opposite end of the thermometer, Thornton saw 175 days with low temperatures below freezing. Denver was very similar with 169 days with temperatures below 32 degrees. On average we expect to see 157 days below freezing.
Our coldest temperature in Thornton came last month on December 5th when the mercury dropped to -9.3 degrees. Denver’s occurred on the same date as the mercury at the airport dropped to -15 degrees.
- Must see photos – Top Shots 2013: ThorntonWeather.com’s top photos of the year
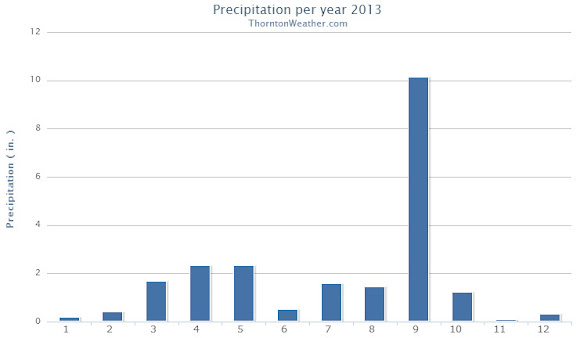
Precipitation for 2013 came in well above normal thanks largely in part to the extraordinary amount of rain received in September.
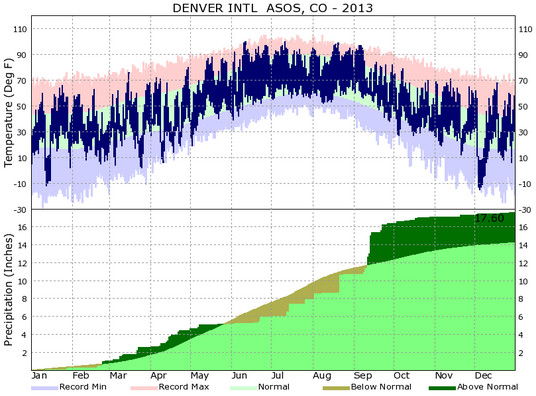
In all, Thornton saw 21.67 inches of liquid precipitation in our bucket. Denver, as always drier due to the station being at DIA, saw 17.60 inches. Both were above the annual average of 14.92 inches.
Above and by far the wettest month of the year was September and was responsible for the above average precipitation numbers. Thornton saw 10.15 inches in the rain bucket that month alone, Denver 5.61 inches.
Snowfall during the calendar year ended up relatively strong thanks to healthy totals from February through April. Overall the rest of the months of the year saw below normal snowfall.
Thornton’s annual snow total came in at an even 70.0 inches. Denver bested us with 74.1 inches during 2013.
Denver’s 2013 / 2014 season however has started out dismally with only 8.1 inches so far in the Mile High City. Thornton ended December a bit better with 10.8 inches. Both are well below the long term average that would have us see 21.2 inches by the end of the year.
Click here to view Thornton’s 2013 climate summary.

CLIMATE REPORT
NATIONAL WEATHER SERVICE BOULDER, CO
427 PM MST WED JAN 1 2014

...................................

...THE DENVER CO CLIMATE SUMMARY FOR THE YEAR OF 2013...

CLIMATE NORMAL PERIOD 1981 TO 2010
CLIMATE RECORD PERIOD 1872 TO 2013

WEATHER         OBSERVED          NORMAL  DEPART  LAST YEAR`S
                 VALUE   DATE(S)  VALUE   FROM    VALUE  DATE(S)
                                          NORMAL
................................................................
TEMPERATURE (F)
RECORD
 HIGH             105   06/26/2012
                        06/25/2012
                        07/20/2005
 LOW              -29   01/09/1875
HIGHEST           100   07/11        64      36      105  06/26
                        06/11                             06/25
LOWEST            -15   12/05        36     -51       -6  01/11
AVG. MAXIMUM     63.9              64.7    -0.8     68.4
AVG. MINIMUM     36.3              36.3     0.0     39.3
MEAN             50.1              50.5    -0.4     53.9
DAYS MAX >= 90     54              39.6    14.4       73
DAYS MAX <= 32     29              20.0     9.0       19
DAYS MIN <= 32    169             156.9    12.1      132
DAYS MIN <= 0      11               5.8     5.2        4

PRECIPITATION (INCHES)
RECORD
 MAXIMUM        23.31   1967
 MINIMUM         7.29   2008
TOTALS          17.60             14.30    3.30    10.11
DAILY AVG.       0.05              0.03    0.02     0.03
DAYS >= .01        82              79.7     2.3       52
DAYS >= .10        42              34.9     7.1       23
DAYS >= .50         8               7.6     0.4        9
DAYS >= 1.00        3               2.3     0.7        1
GREATEST
 24 HR. TOTAL    2.39   09/13 TO 09/14

 STORM TOTAL     4.65   09/09 TO 09/15

SNOWFALL (INCHES) RECORDS
TOTAL          115.9   1913
24 HR TOTAL     23.6   12/24/1982 TO 12/24/1982
SNOW DEPTH        MM   MM
TOTALS           72.1              53.8    18.3     38.5
 LIQUID EQUIV    5.40              5.40      MM     3.85
SINCE 7/1         8.1              22.5   -14.4     12.4
 LIQUID 7/1      0.81              2.20   -1.39     1.24
SNOWDEPTH AVG.      0                MM      MM        0
DAYS >= TRACE      60              33.3    26.7       36
DAYS >= 1.0        20              16.3     3.7       13
GREATEST
 SNOW DEPTH         9   02/25                         11  02/04
 24 HR TOTAL      9.1   02/24 TO 02/24              12.5  03/03
 STORM TOTAL     11.7   03/22 TO 03/24              15.9  03/02
                                                          03/04

DEGREE_DAYS
HEATING TOTAL    6302              6059     243     5198
 SINCE 7/1       2451              2468     -17     2233
COOLING TOTAL     999               769     230     1236
 SINCE 1/1        999               769     230     1236

FREEZE DATES
RECORD
 EARLIEST     09/08/1962
 LATEST       06/08/2007
EARLIEST                        10/07
LATEST                          05/05
..................................................

WIND (MPH)
AVERAGE WIND SPEED              9.7
RESULTANT WIND SPEED/DIRECTION   2/201
HIGHEST WIND SPEED/DIRECTION    64/060    DATE  06/18
HIGHEST GUST SPEED/DIRECTION    97/040    DATE  06/18

SKY COVER
POSSIBLE SUNSHINE (PERCENT)   MM
AVERAGE SKY COVER           0.60
NUMBER OF DAYS FAIR           69
NUMBER OF DAYS PC            232
NUMBER OF DAYS CLOUDY         64

AVERAGE RH (PERCENT)     52

WEATHER CONDITIONS. NUMBER OF DAYS WITH
THUNDERSTORM              0     MIXED PRECIP               0
HEAVY RAIN               14     RAIN                      25
LIGHT RAIN               80     FREEZING RAIN              0
LT FREEZING RAIN          4     HAIL                       0
HEAVY SNOW               11     SNOW                      23
LIGHT SNOW               58     SLEET                      0
FOG                     105     FOG W/VIS <= 1/4 MILE     33
HAZE                     88

-  INDICATES NEGATIVE NUMBERS.
R  INDICATES RECORD WAS SET OR TIED.
MM INDICATES DATA IS MISSING.
T  INDICATES TRACE AMOUNT.