 We have been busy the last couple of days with some pretty neat enhancements to our website. The most obvious one being the addition of a “fly-out” menu on the left. The previous menu was getting quite lengthy as we added new features to the site. The new menu allows us to group items into main menu categories that when moused over then open a list of related items. This should make it easier to navigate plus allow you to better see items that you may be interested in.
Weather is very data oriented and the more you have, the more you know. To this end we have added a “Historical Statistics” page. This page draws from data we have submitted to Weather Underground since our inception in October 2006. Using it, you can view graphs and data for individual days, weeks, months and even full years. Simply select a date, click View and you receive all the weather data for that day. Click the week, month or year links and see data for those time periods as well. There is also a dropdown that allows you to view data from our sister stations in Arvada (arvadawx.com) and Commerce City (reunionweather.com).
Lastly is an exciting new feature – ThorntonWeather.com’s own NEXRAD radar system. Using specialized software, we can now generate our own radar images. That in and of itself is interesting but what really makes this system exciting is the data we can present on it. Not only radar images but also lightning data, thunderstorm information, and much more. We are still studying how best to share all of this information with our visitors but it looks to be a pretty neat addition to the site. At the current time you can view a single static image from the system or a radar loop that displays the last 2 hours of radar returns. Be sure to look below the radar images too – you will see a table that when a severe thunderstorm appears, will show you critical information about the storm including the chance for hail and even the predicted path of the storm.
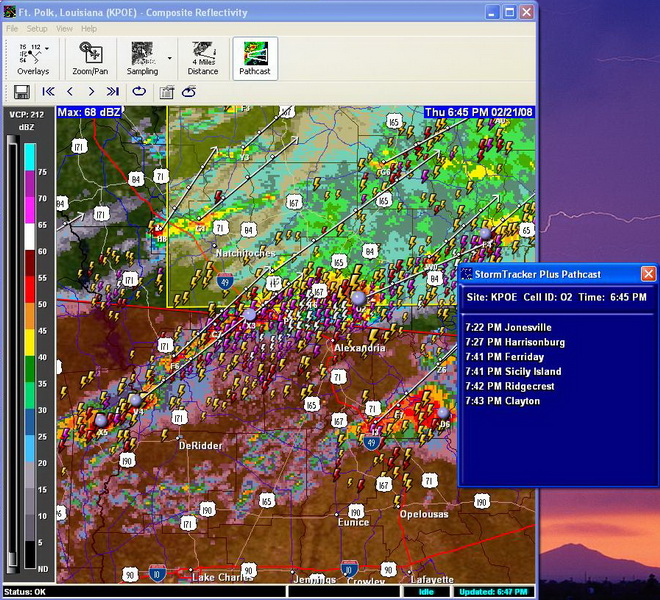 For a sample of what a severe storm looks like on our computers using this new software, click on the image to the right. This is a screenshot of a storm as it moved across Louisana last week. Notice how it plots the radar, lightning strikes, storm cells and a path forecast.
So what do you think? If you have any comments, questions, suggestions or criticisms about our site please send us an email with anything you might have to say.